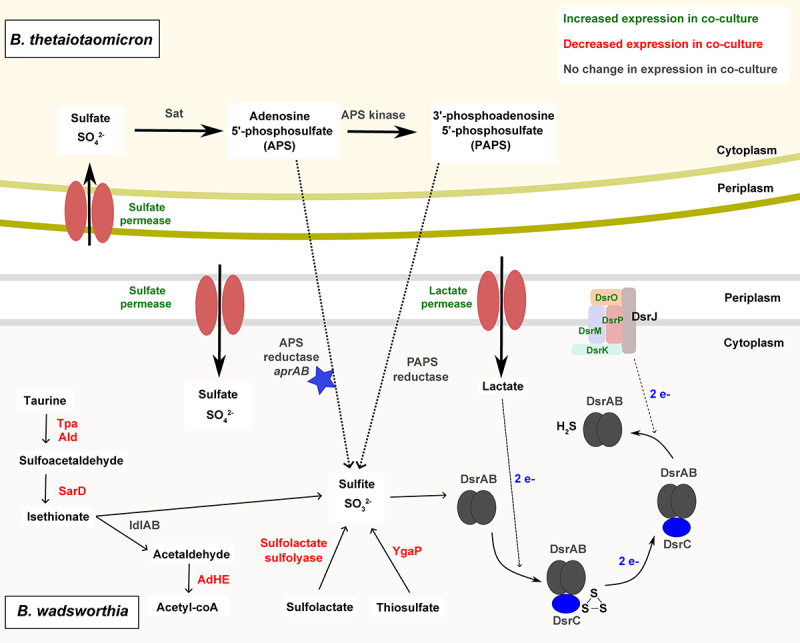
Figure 3.

Model of cross-feeding interaction between B. wadsworthia and B. thetaiotaomicron. Enzymes are shown in colors corresponding to transcriptomic data: green showed increased gene expression in co-culture; red showed decreased expression in co-culture; gray showed no change in expression between co-culture and monoculture. The blue star represents a putative enzyme where functionality is unproven. The dotted line represents a putative cross-feeding mechanism. Dashed lines represent electron transfer.
