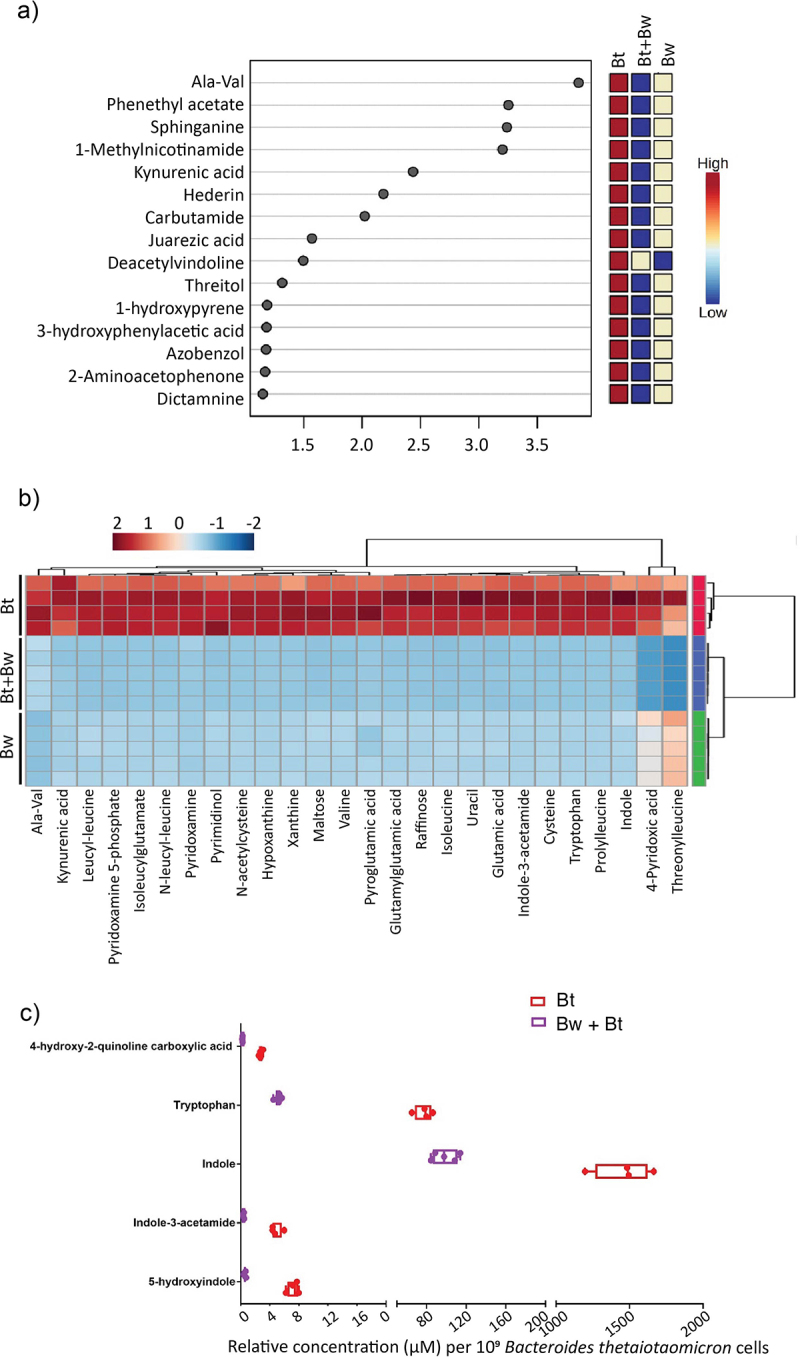
Figure 6.

Comparisons of the endometabolome of B. wadsworthia and B. thetaiotaomicron in co-culture (Bw + Bt) with monocultures (Bw, Bt). a) the top compounds ranked based on the variable importance in projection (VIP) scores. The colored boxes on the right indicate the relative concentrations of the corresponding metabolite in each group. b) specific metabolites of interest manually curated from the compound list detected via untargeted LC-MS. c) relative intracellular concentrations of compounds related to tryptophan metabolism in B. thetaiotaomicron (Bt) in monoculture and co-culture with B. wadsworthia (Bw + Bt). Concentration is standardized to B. thetaiotaomicron cell counts. Each point represents a culture replicate. Box and whisker plots show line at mean, box at 25th −75th percentile, whiskers to minimum and maximum.
