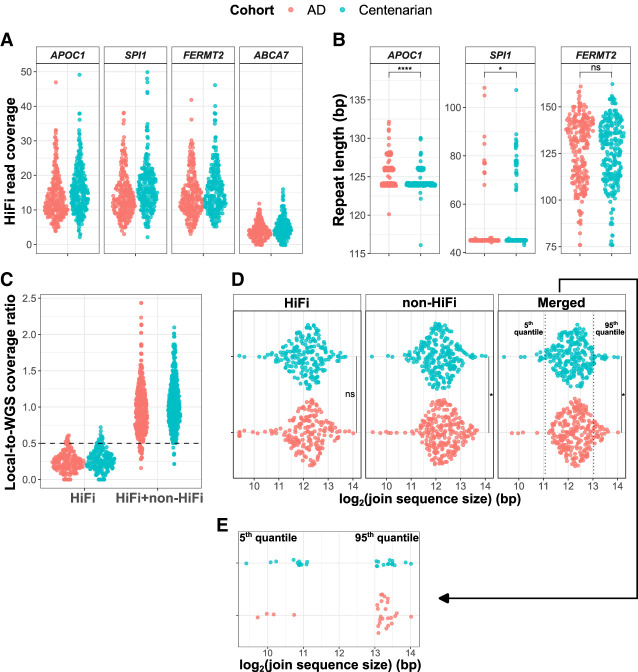
Figure 5.
Replication of the association with AD of TRs in APOC1, SPI1, FERMT2, and ABCA7. (A) The coverage distribution of the four TRs in AD patients and cognitively healthy centenarians. (B) The TR size difference between AD patients and cognitively healthy centenarians in APOC1, SPI1, and FERMT2. For the associations, we used logistic regression models using the TR size as predictor for AD case-control status. (C) HiFi and combined HiFi + non-HiFi coverage distribution of the TR intronic of ABCA7 gene. (D) Comparison of the joint allele size of ABCA7 TR between AD cases and cognitively healthy centenarians, respectively, using HiFi data, non-HiFi data, and the merged data set of HiFi and non-HiFi. (E) Number of AD cases and cognitively healthy centenarians in the lower 5th quantile and upper 95th quantile. Quantiles were defined based on the distribution of the joint TR allele size in the centenarians. We tested for the differential enrichment of AD and centenarians in each quantile with Fisher's exact tests.

