Figure 1.
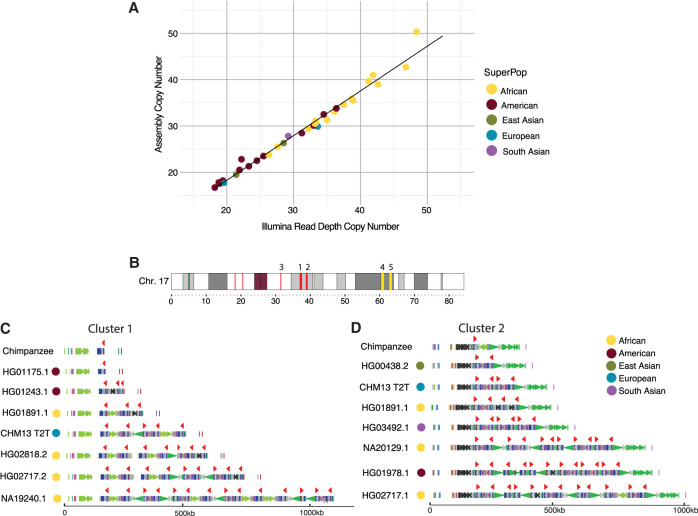
Assembly and human variation of TBC1D3. (A) Assembly copy-number estimate versus orthogonal Illumina sequence copy-number estimate. Each point represents a sample diploid assembly, colored by superpopulation. (B) Reference ideogram of TBC1D3 regions. Expanded views of clusters 1 and 2 (marked in red) are illustrated in C,D. (C,D) Structure for chimpanzee and seven validated human haplotypes over TBC1D3 cluster 1 (C) and cluster 2 (D). TBC1D3 copies are colored as red arrows. Colored arrows below TBC1D3 illustrate segmental duplication content annotated with DupMasker (Jiang et al. 2008).

