Figure 2.
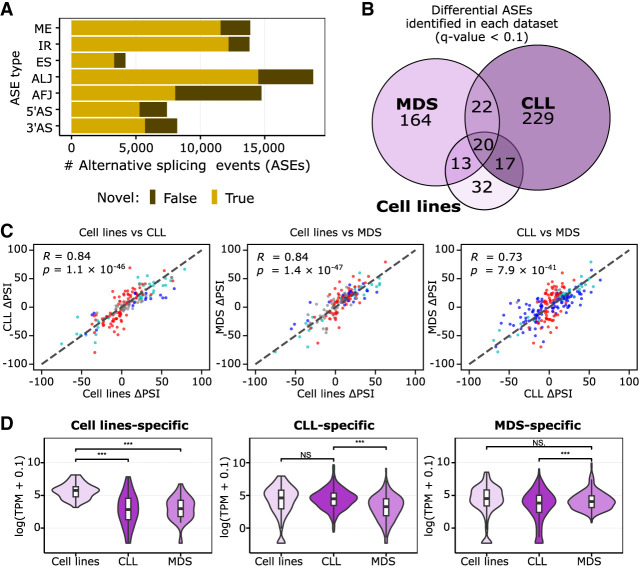
SF3B1 mutation effect is independent of the biological background, but its manifestation depends on the transcriptomic profile. (A) The number of alternative splicing events (ASEs) identified with Iso-Seq separated by splicing event type in all groups investigated, differentiated by the novelty class. (B) Overlap between significantly altered ASEs in samples with the SF3B1 mutation identified in the three data sets used (cell lines, CLL patients, or MDS patients). (C) Correlation of isoform usage measured by the difference in PSI from all events listed in B; namely, events called significant in at least one of the three data sets are shown. The colors of the dots correspond to significance reached only in one set: blue indicates x-axis only; red, y-axis only; light blue, both; and gray, none (i.e., called significant in a data set absent from the graph). Pearson correlation coefficient (R) and associated P-value (P) are given. (D) Violin plots with boxplots show the distribution of expression values of the genes with data set–specific ASEs from C. Significant differences are marked with as follows: (***) paired, two-tailed Student's t-test P-value < 0.001, (**) P-value < 0.01, (*) P-value < 0.05, (N.S.) not significant with P-value ≥ 0.05.

