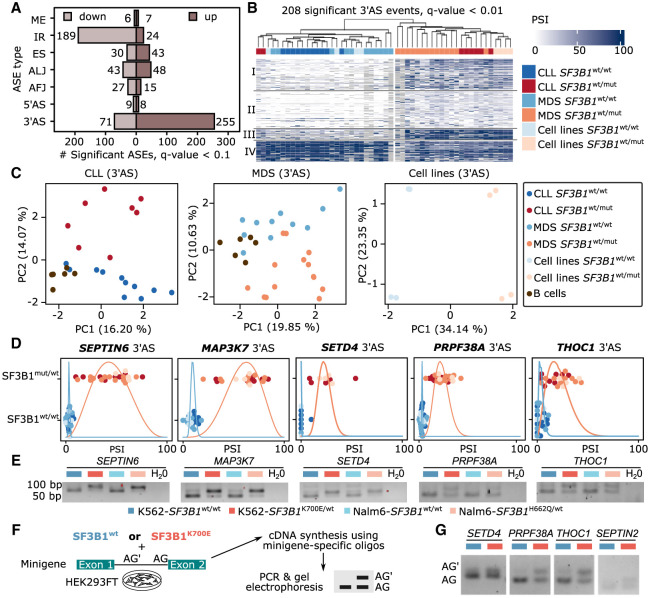
Figure 3.
SF3B1 mutation increases 3′ alternative splice site (3′AS) usage and decreases intron retention. (A) Number of differential ASEs with shorter or longer variant expression (percentage spliced index [PSI]) in SF3B1mut/wt versus SF3B1wt/wt samples. (B) Highly significantly altered (Q-value < 0.01) 3′ASs clearly separate samples by SF3B1 mutations in leukemia cell lines as well as CLL and MDS patients based on the longer variant PSI values showing four clusters described in Supplemental Figure S19. (C) Principal component (PC) analysis, based on the isoform usage of 3′ASs, clearly separates CLL and MDS patients, as well as cell lines, according to the SF3B1 mutational status. (D) Swarm plots showing the distribution of the isoform usage (PSI) among groups with or without SF3B1 mutation. (E) Validation of the differential splicing associated with SF3B1 mutation with RT-PCR experiments in isogenic K562 and Nalm6 cell lines. (F) Minigene assays workflow. HEK293T cells were cotransfected with minigenes and either SF3B1wt or SF3B1K700E for 48 h. RNA was extracted and used for amplification of splicing products with minigene-specific primers. (G) The results from the minigene assay from F. The lower band in the agarose gel corresponds to the usage of the canonical AG, the upper band to the upstream AG′.

