Figure 5.
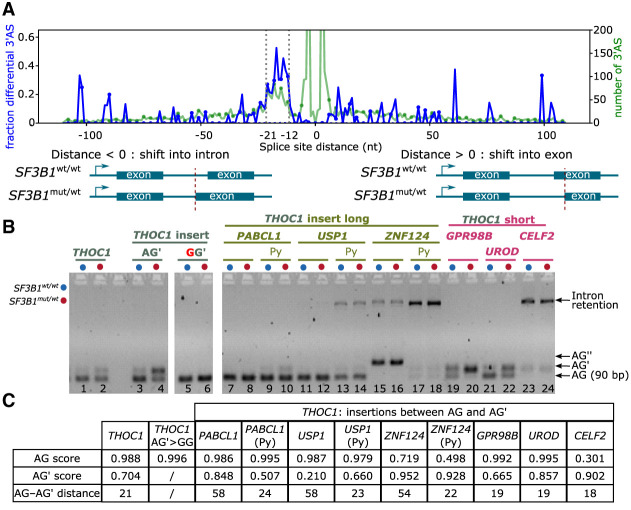
SF3B1 mutations promote upstream 3′ASs and partially dependent on the sequence context. (A) 3′AS distance distribution. Negative distances indicate an alternative was located upstream, and positive values indicate an alternative located downstream, leading to a shorter exon. Blue line represents proportion; green, the total number of 3′ASs. Dotted vertical lines indicate the enriched region of 12–21 nt upstream of the canonical AG. (B) Minigene assays with long (45–50 bases) AG– AG′ inserts, shortened inserts containing ∼20 nt directly upstream the AG including the polypyrimidine (Py) tract, and short (15–20 nt) AG–AG′ inserts from nondifferentially alternatively spliced 3′AS events. The chosen events without differential splicing detected with SF3B1 mutation were from PAPCL1, USP1, and ZNF124 (AG′–AG distance >50 nt) as well as GPR98B, UROD, and CELF2 (AG′–AG distance <20 nt). (C) Table showing splice-site strength for AG and AG′ calculated with SpliceRover (Zuallaert et al. 2018).

