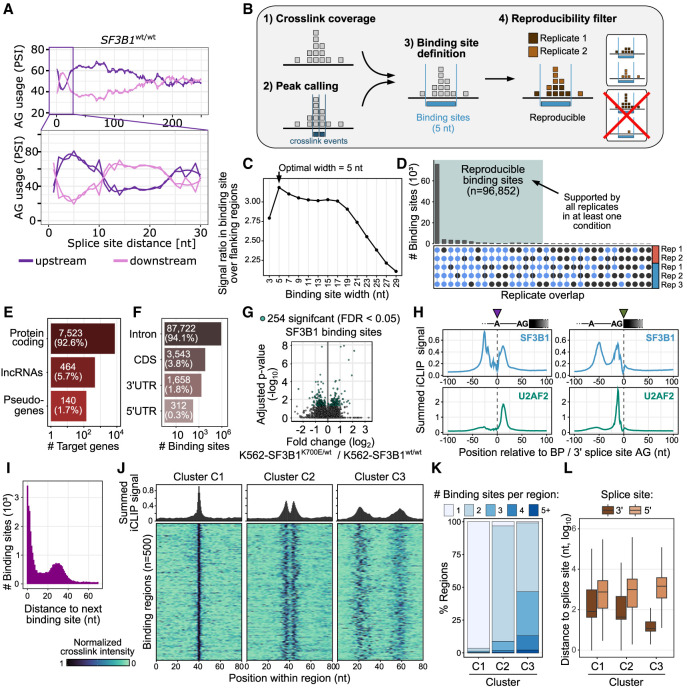
Figure 6.
Multimodal SF3B1 binding. (A) The SF3B1 choice of AG within a narrow window of 12–21 nt is strongly affected by the alternative splice-site distance. The AG usage is shown as the PSI as a function of the splice-site distance in SF3B1wt/wt. The rolling mean across 20 nt and the smoothed (loess method) trend line are shown for upstream (violet) and downstream (pink) AG. (B) Schematic workflow of processing iCLIP reads and calling SF3B1 binding sites. (C) Defining optimal site binding width. A binding site width of 5 nt optimally captures the SF3B1 cross-link events. Dot plot shows average ratio of cross-link events within binding sites of increasing widths (x-axis) over the mean background signal in flanking windows of the same size, indicating how much more signal occurs within the binding sites compared with their immediate surrounding. (D) SF3B1 binding sites reproducibility across replicates. Upper panel shows overlaps of supported binding sites in the replicates, with threshold for sufficient coverage individually adjusted to the signal depth in each replicate (Busch et al. 2020). (E) Gene classes targeted by SF3B1 based on iCLIP. (F) Transcript regions of protein-coding genes targeted by the SF3B1 based on iCLIP. (G) Differential SF3B1 binding sites in K562-SF3B1K700E/wt versus K562-SF3B1wt/wt. (H) Metaprofiles of SF3B1 (top) and U2AF2 (bottom) binding centered at branch-point adenosine (left) and 3′ splice-site AG (right). (I) Distribution of distances between neighboring binding sites. (J) Density plot and heat map showing SF3B1 patterns in regions from three cluster types identified in Supplemental Figure S35. (K) Distribution of the number of binding sites per region for each of the three clusters. (L) Distribution of the distance between SF3B1 binding region and closest splice site.

