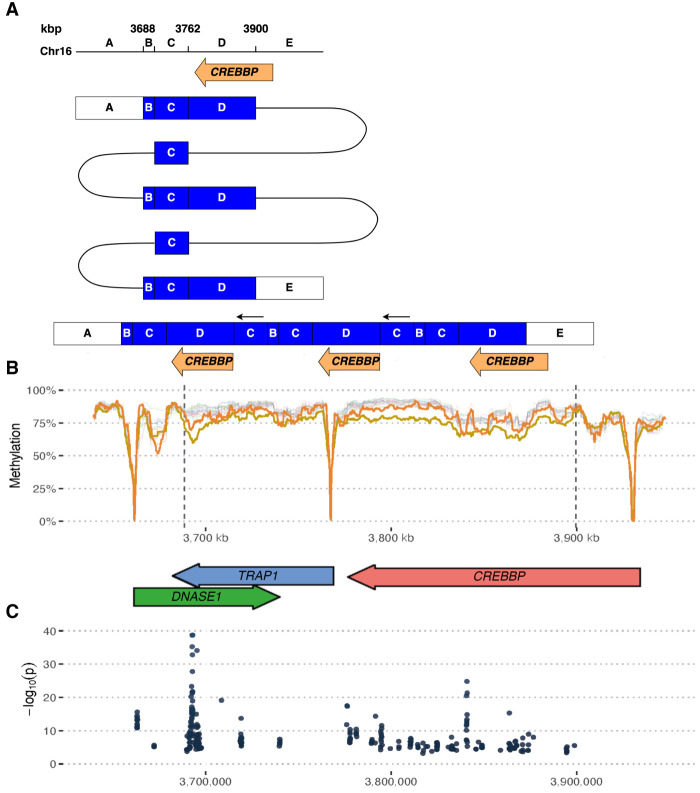
Figure 5.
A CREBBP rearrangement with altered methylation. (A) Schematic of a complex rearrangement affecting CREBBP. (B) CpG methylation across the region in the proband (yellow), the carrier father (orange), and all other samples in this study. Methylation signal expressed as a mean number of methylated calls in rolling windows of 150 CpG sites. Note how hypomethylation regions are associated with gene promoters, and there is an overall decreased methylation level across the rearrangement area in the proband and his father. (C) Analysis of significantly differentially methylated loci between proband and all individuals who do not carry the CREBBP CGR (P < 0.01).

