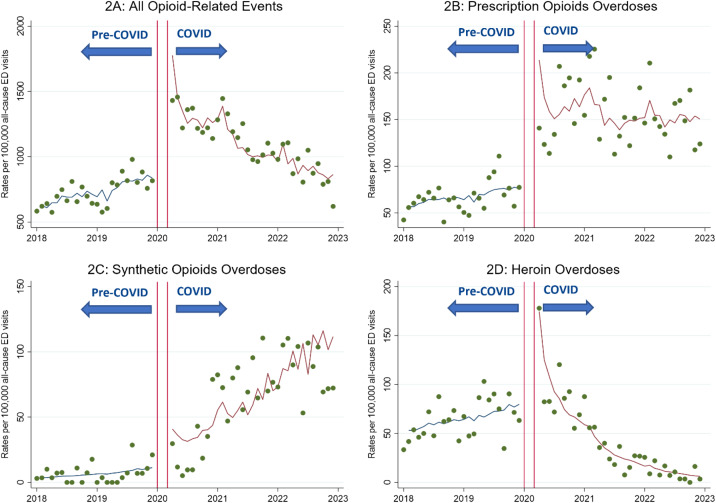
Figure 2.
Monthly emergency department (ED) visit rates of opioid-related disorders and overdoses (per 100,000 all-cause ED visits) from 2018–2022 across six University of California Health centers. The period from January 2018– December 2019 was designated as “pre-COVID,” while the period from April 2020–December 2022 was designated as “COVID.” A washout period from January–March 2020 was implemented and is represented by the red lines in the graph.

