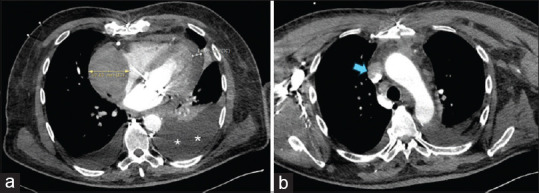
Figure 2.

Computed tomography images. (a) Collection with a maximum thickness of 6 cm (yellow arrow) with a mass effect that deforms and compresses the posterior surface of the right atrium. Cardiac tamponade of 1.4 cm at the cardiac apex (white arrow). Severe left pleural effusion (**). (b) The collection also compresses the entrance to the superior vena cava (blue arrow)
