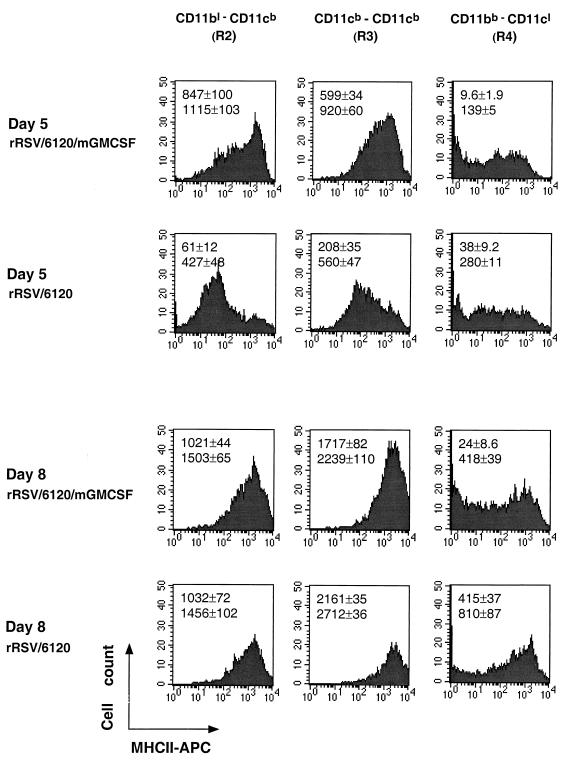
FIG. 8.
Flow cytometry analysis of the three fractions of PMC, namely, regions R2, R3, and R4 shown in Fig. 7B, for the expression of MHCII molecules. Results are shown for days 5 and 8 postinfection for a single mouse from each group of four animals. The median (upper value) and mean (lower value) level of MHCII expression (±SE) for each group of four are indicated.

