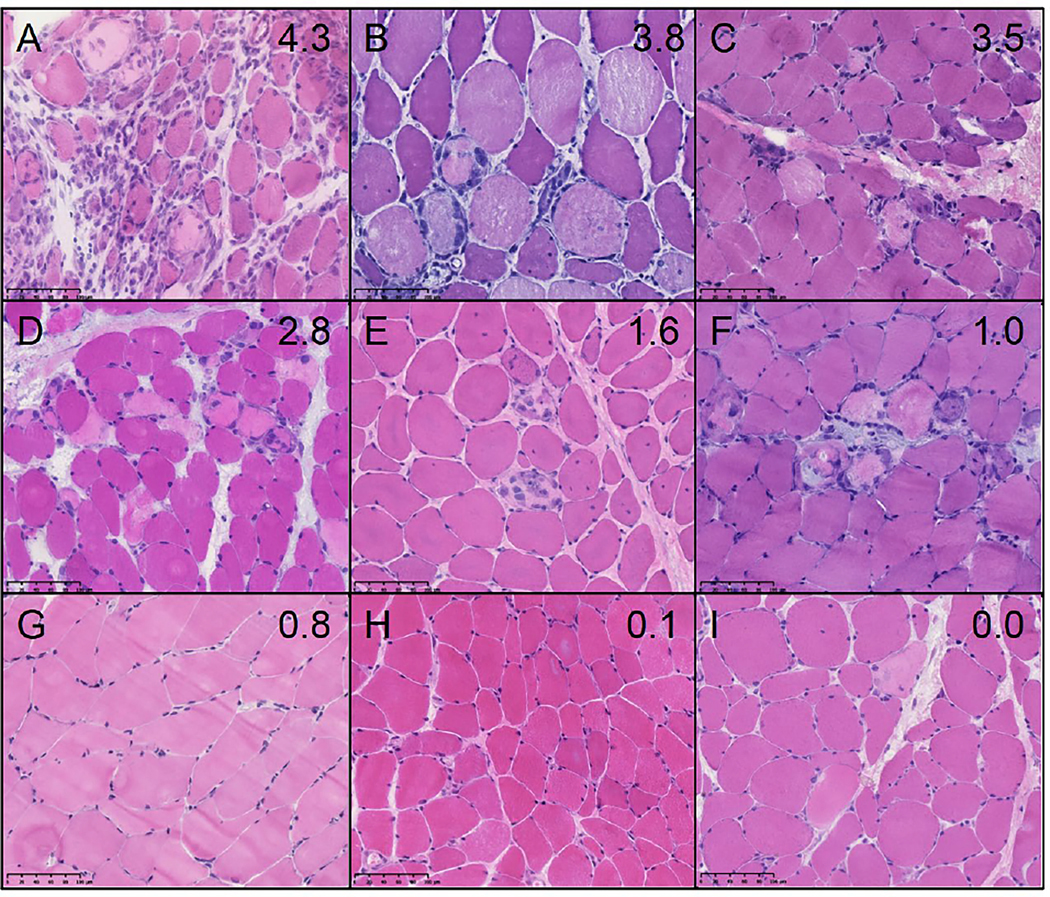
Figure 6.

The expression levels of SCRT1 correlate with the intensity of myofiber necrosis and inflammation. Representative hematoxylin and eosin staining of anti-Mi2 dermatomyositis muscle biopsies sorted according to the RNA expression levels of SCRT1. Biopsies A-C have a high expression of SCRT1 (over 3 log2[TMM+1]), D-F have an intermediate expression (between 1 and 3 log2[TMM+1]), and G-I have a low expression (<1 log2[TMM+1]). The individual expression levels of SCRT1 (log2[TMM+1]) are indicated in the top right corner of each image.
