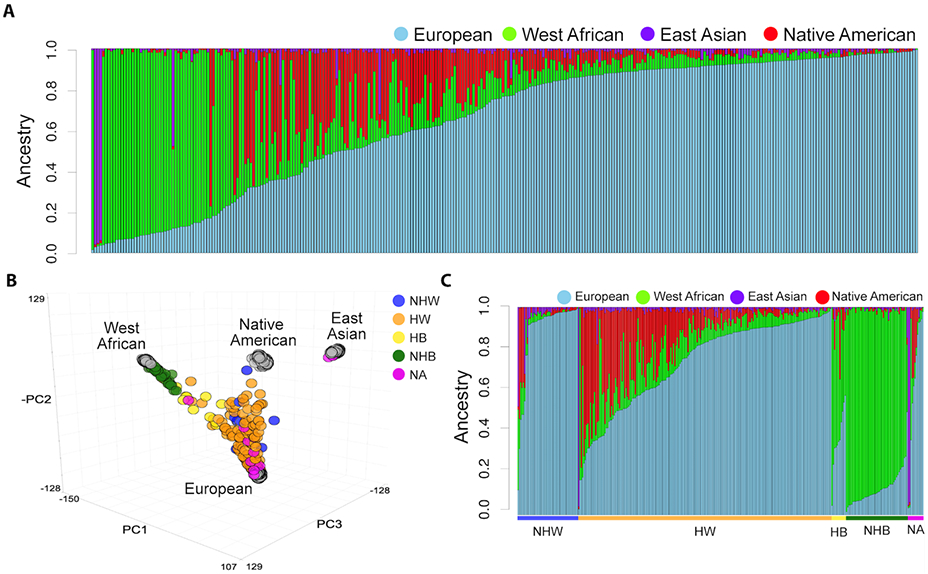
Figure 1. Population structure of patients with invasive breast cancer.

(A) Stacked barplot of ancestral percentages after unsupervised clustering using ADMIXTURE analysis of our cohort assuming K=4 ancestral clusters. Each bar represents one individual and the height of each segment represents the respective ancestral percentage. (B) Principal component analysis (PCA) based global ancestral genotypes across the cohort (colored circles) and the global ancestry reference panel (grey circles). (C) Stacked barplot of ancestral percentages grouped by self-reported race/ethnicity category. Non-Hispanic white (NHW), Hispanic white (HW), non-Hispanic black (NHB), Hispanic black (HB), and not available (NA).
