
Figure 3. Admixture and fine mapping.
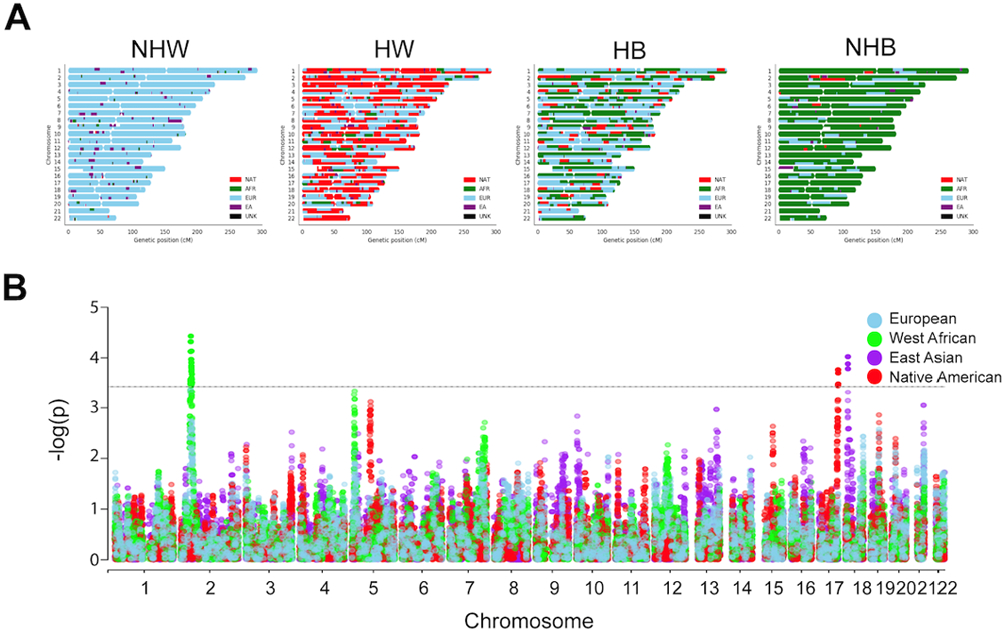
(A) Representative karyograms, after local ancestry estimation, for patients identifying as non-Hispanic white (NHW), Hispanic white (HW), Hispanic black (HB), or non-Hispanic black (NHB). European (EU), West African (WA), East Asian (EA), Native American (NAT), and unknown (UNK). (B) Manhattan plot of ancestral segments associated with triple negative breast cancer (TNBC) representing results of multinomial regression and admixture mapping. X-axis, chromosome position; Y-axis, −log10 (p value) after multinomial regression for tumor subtype and local ancestry at each variant, correcting for age, stage, nSES, and the proportion of WA, NAT, and EA ancestries with respect to EU ancestry. Each dot represents an ancestral segment tested in the association test. Horizontal dashed lines represent significance threshold, p < 3.7x10⁻⁴.