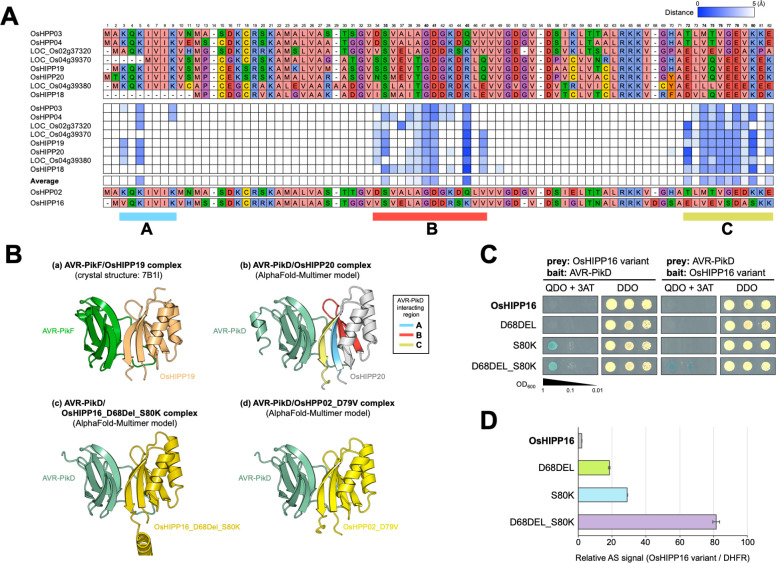
Fig 2. Three regions of sHMAs are predicted to have close contact with AVR-PikD.
(A) Amino acid sequence alignment of sHMAs (top) and a matrix of distance of each amino acid residue to AVR-PikD protein as predicted by ColabFold (bottom). Predicted atomic distance below 5Å are indicated by blue tiles. Three regions indicated by A, B and C are predicted to be in close contact with AVR-PikD. (B) Binding structures between AVR-PikF (green) and OsHIPP19 (light orange) (a: Crystal structure; Maidment et al. 2021) [29], predicted structure between AVR-PikD (light green) and OsHIPP20 (grey) (b: AlphaFold-multimer model), predicted structure between AVR-PikD (light green) and OsHIPP16_D68DELS80K (dark yellow) (c: AlphaFold-multimer model), and predicted structure between AVR-PikD (light green) and OsHPP02_D79V (yellow) (d: AlphaFold-multimer model). (C) Y2H interactions between the variants of OsHIPP16 (OsHIPP16, OsHIPP16_D68DEL, OsHIPP16_S80K, OsHIPP16_D68DEL_S80K) and AVR-PikD. (D) AlphaScreen interactions between the variants of OsHIPP16 (OsHIPP16, OsHIPP16_D68DEL, OsHIPP16_S80K, OsHIPP16_D68DEL_S80K) and AVR-PikD. The values are relative AlphaScreen signals (AS) to that of OsHIPP16/DHFR interaction signal (negative control). The error bars represent SD of 3 replications.

