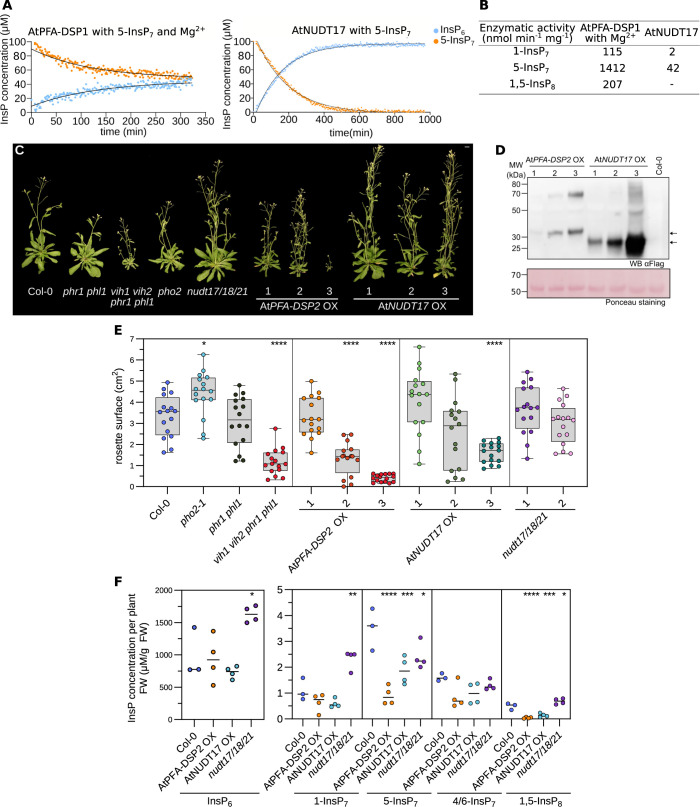
Fig 1. Overexpression of inositol pyrophosphate phosphatases restricts Arabidopsis growth and alters PP-InsP levels.
(A) NMR-based inositol phosphatase assays. Shown are time course experiments of AtPFA-DSP1 and AtNUDT17 using 100 μM of [13C6] 5-InsP7 as substrate. Pseudo-2D spin-echo difference experiments were used and the relative intensity changes of the C2 peaks of InsP6 and 5-InsP7 as function of time were quantified. (B) Table summaries of the enzymatic activities of AtPFA-DSP1 and AtNUDT17 vs. PP-InsPs substrates. (C) Growth phenotypes of 4-week-old nudt17/18/21, AtPFA-DSP2 OX and AtNUDT17 OX plants. phr1 phl1, vih1 vih2 phr1 phl1, pho2 mutants and Col-0 plants of the same age are shown as controls. Plants were germinated on ½MS for one week before transferring to soil for additional 3 weeks. Scale bar = 1 cm. (D) Western blot of AtPFA-DSP2 OX and AtNUDT17 OX plants vs. the Col-0 control. AtPFA-DSP2-Flag has a calculated molecular mass of ~31 kDa and AtNUDT17-Flag of ~24 kDa. A Ponceau stain is shown as loading control below. Arrows indicate the expected sizes of AtPFA-DSP2 (top) and AtNUDT17 (bottom). (E) Rosette surface areas of 3-week-old nudt17/18/21, AtPFA-DSP2 OX and AtNUDT17 OX plants, controls as in (C). Different genotypes are shown in different colors, independent transgenic T3 lines per genotype in different color shadings. Multiple comparisons of the genotypes vs. wild-type (Col-0) were performed using a Dunnett [105] test as implemented in the R package multcomp [106] (**** p < 0.001, *** p < 0.005, ** p < 0.01, * p < 0.05). (F) Whole tissue InsP6 and PP-InsP quantification of 2-week-old Col-0, nudt17/18/21, AtPFA-DSP2 OX and AtNUDT17 OX seedlings. (PP-)InsPs were extracted with titanium oxide beads and then quantified by CE-ESI-MS. Multiple comparisons of the genotypes vs. wild-type (Col-0) were performed using a Dunnett [105] test as implemented in the R package multcomp [106] (**** p < 0.001, *** p < 0.005, ** p < 0.01, * p < 0.05).

