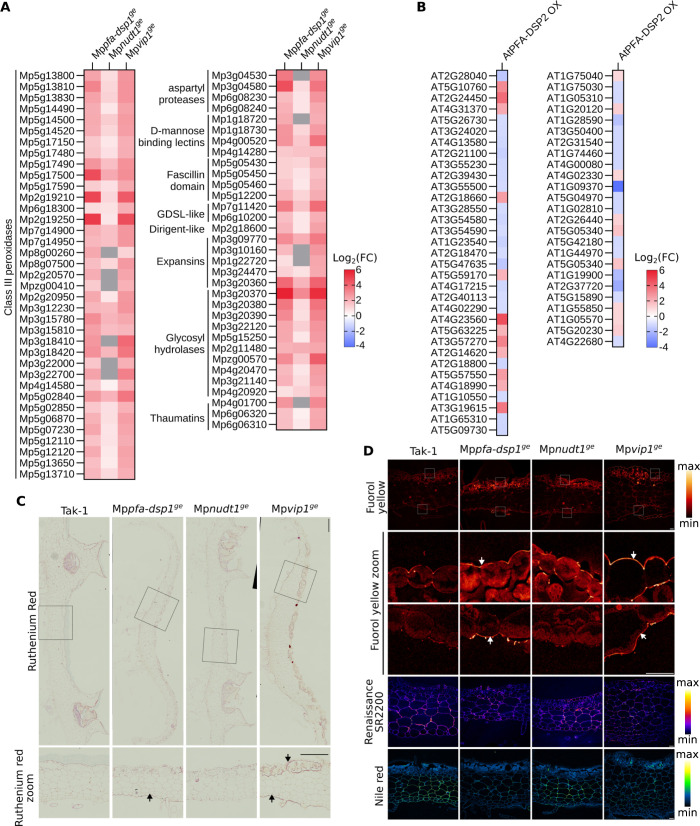
Fig 5. Cell wall composition is altered in Mppfa-dsp1ge and Mpvip1ge mutant plants.
(A) Heatmap of differentially expressed genes (DEGs) in 3-week-old Mppfa-dsp1ge, Mpnudt1ge and Mpvip1ge plants grown under Pi-sufficient conditions vs. Tak-1. Genes significantly different from Tak-1 and putatively involved in cell wall homeostasis are displayed. Grey boxes = not differentially expressed. (B) Heatmap of DEGs of 2-week-old AtPFA-DSP2 OX plants vs. Col-0. (C) Fixed transverse cross-sections at the level of gemmae cups from 3-weeks-old Tak-1, Mppfa-dsp1ge, Mpnudt1ge and Mpvip1ge plants, stained with ruthenium red. Enlarged views of ruthenium red-stained sections are below their respective genotypes. Scale bars: 500 μm (top panels) and 10 μm (bottom panels). Regions in Mppfa-dsp1ge or Mpvip1ge enriched in cell wall material compared to Tak-1 are marked by arrows. (D) From top to bottom: fluorol yellow-stained sections, enlarged view of fluorol yellow-stained dorsal side, enlarged view of fluorol yellow-stained ventral side (scale bar = 40 μm), total view of the Renaissance SR2200-stained cross-sections (scale bar = 50 μm) and total view of the nile red-stained cross-sections (scale bar = 50 μm). Lookup tables for fluorol yellow, Renaissance SR2200 and nile red stainings are shown alongside. Regions in Mppfa-dsp1ge or Mpvip1ge enriched in cell wall material compared to Tak-1 are marked by arrows.

