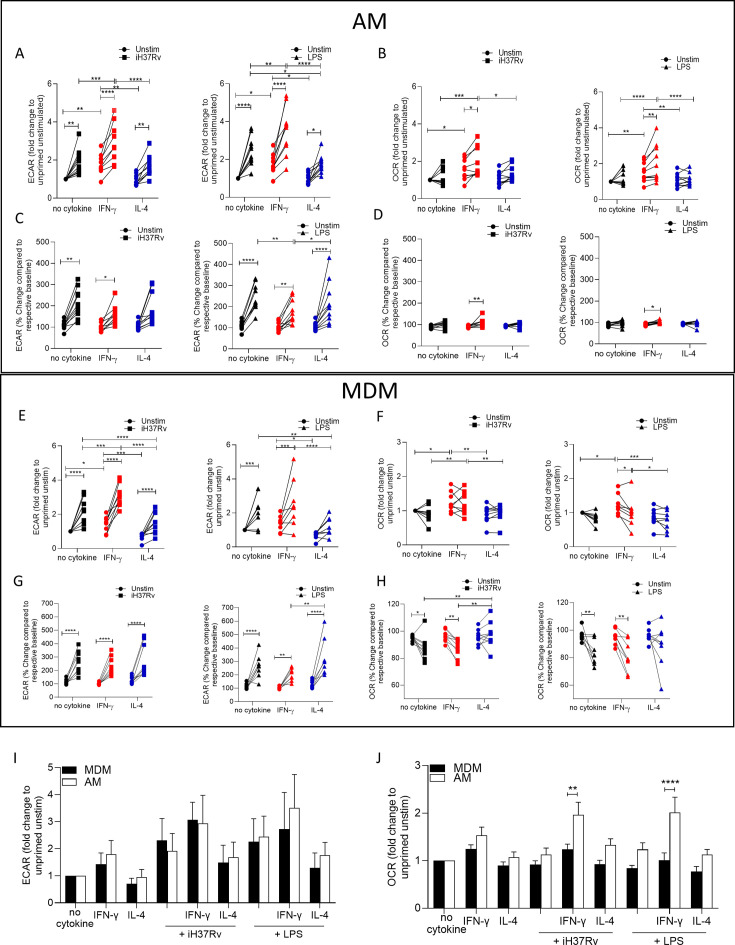
Figure 1. IFN-γ increases energetic metabolism in the AM but enhances ‘Warburg’-like metabolism in MDM in response to inflammatory stimuli.
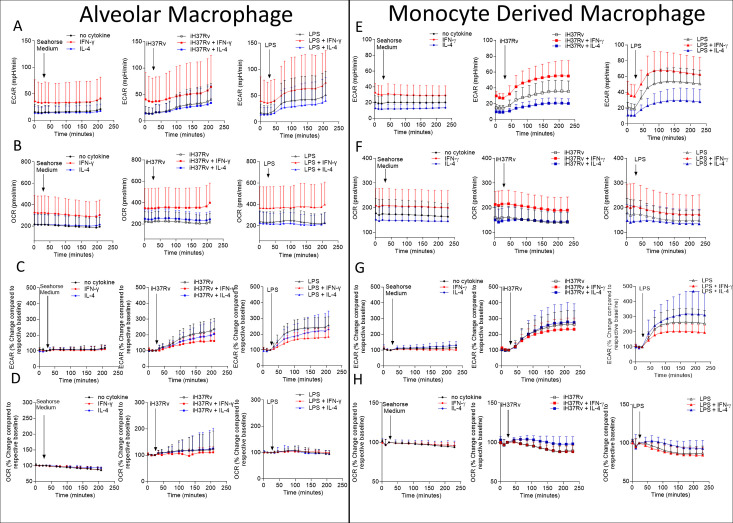
Human AM (A–D) were isolated from bronchoalveolar lavage fluid. PBMC were isolated from buffy coats and MDM (E–H) were differentiated and adherence purified for 7 days in 10% human serum. Cells were left unprimed (black) or primed with IFN-γ (red) or IL-4 (blue; both 10 ng/ml) for 24 hr. Baseline measurements of the Extracellular Acidification Rate (ECAR) and the Oxygen Consumption Rate (OCR) were established before AM or MDM were stimulated with medium (circle), irradiated Mtb H37Rv (iH37Rv; MOI 1–10; square) or LPS (100 ng/ml; triangle), in the Seahorse XFe24 Analyzer, then monitored at 20 min intervals. At 150 min, post stimulation fold change in ECAR (A, E, I) and OCR (B, F, J) was analysed, and percentage change (from baseline of the respective treatment group) was also calculated for ECAR (C, G) and OCR (D, H) at 150 min. A direct comparison of AM (white bar) and MDM (black bar) was also assessed at 150 min (I, J). Each linked data point represents the average of technical duplicates for one individual biological donor (MDM; n=8–9, AM; n=9–10). Statistically significant differences were determined using two-way ANOVA with a Tukey (A–H) or Bonferroni post-test (I–J); *p≤0.05, **p≤0.01, ***p≤0.001, ****p≤0.001.


