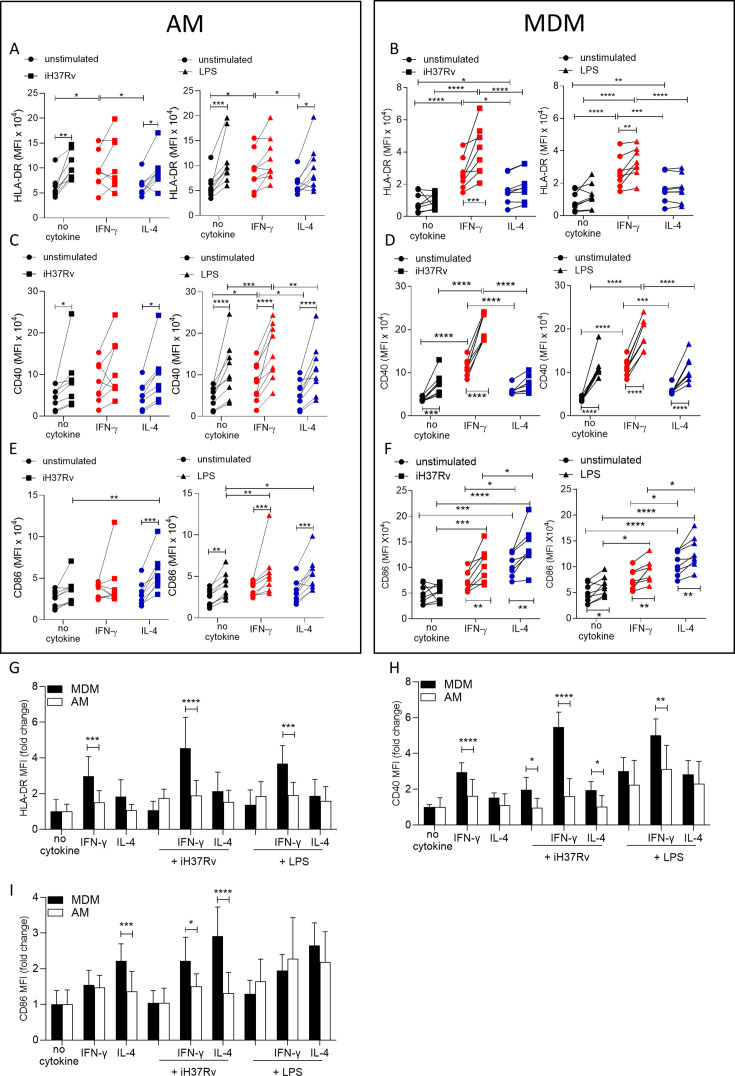
Figure 2. IFN-γ boosts activation marker expression on MDM to a greater extent than AM.
Human AM (A, C, E) isolated from bronchoalveolar lavage fluid. PBMC were isolated from buffy coats and MDM (B, D, F) were differentiated and adherence purified for 7 days in 10% human serum. Cells were left unprimed (black) or primed with IFN-γ (red) or IL-4 (blue) (both 10 ng/ml) for 24 hr. AM or MDM were left unstimulated (circle) or stimulated with iH37Rv (MOI 1–10; square) or LPS (100 ng/ml; triangle). After 24 hr, cells were detached from the plates by cooling and gentle scraping and stained for HLAR-DR (A, B), CD40 (C, D), CD86 (E, F) and analysed by flow cytometry. Fold change of HLA-DR (G), CD40 (H) and CD86 (I) was calculated for AM (white bar) and MDM (black bar) based on the average of their respective no cytokine controls. Each linked data point represents the average of technical duplicates for one individual biological donor (n=8–9). Statistically significant differences were determined using two-way ANOVA with a Tukey (A–F) or Bonferroni post-test (G–I); *p≤0.05, **p≤0.01, p***≤0.001, ****p≤0.001.


