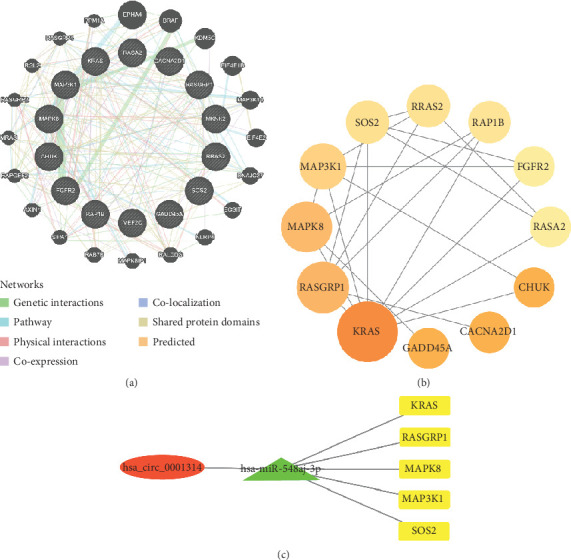
Figure 3.

Construction of the network. (a) The GGI network of mRNAs. (b) The PPI network of mRNAs. (c) Cytoscape software was applied to create a visualization of the ceRNA network, which included one circRNA (hsa_circ_0001314), one miRNA (hsa-miR-548aj-3p), and five mRNAs (KRAS, RASGRP1, MAPK8, MAP3K1, and SOS2) (red: circRNA; green: miRNA; yellow: mRNAs).
