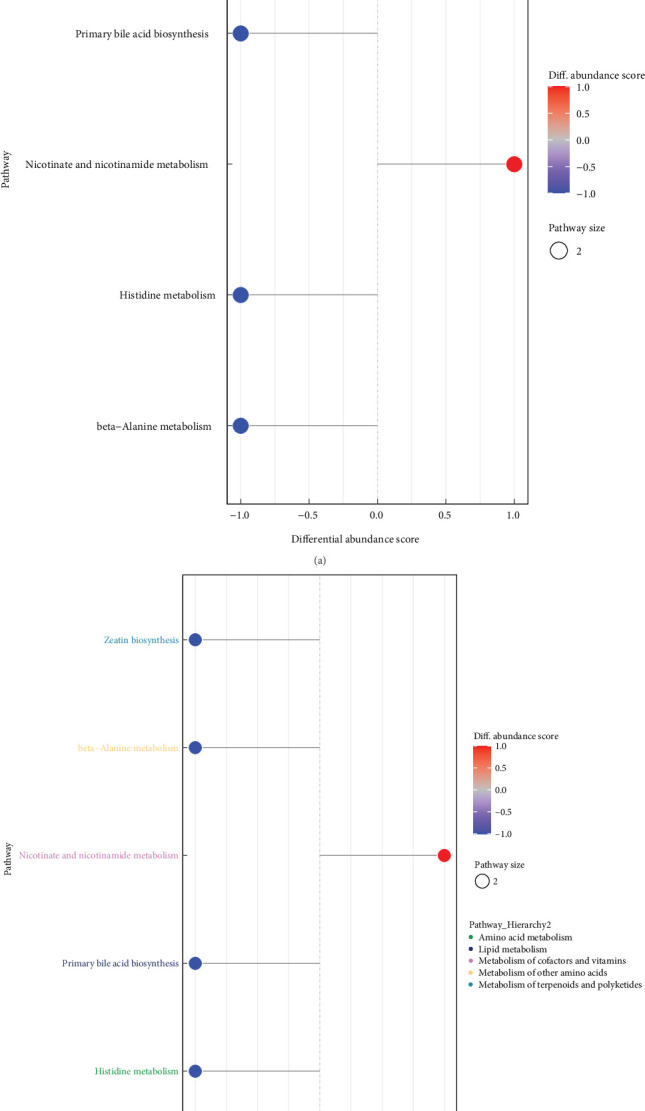
Figure 13.

Differential abundance score analysis. (a and b) The plot shows the differential abundance scores of enriched metabolic pathways, categorized by pathway_Hierarchy. Each pathway is represented on the Y-axis, while the X-axis represents the differential abundance score (DA score), which reflects the total variation of all metabolites in the pathway. A score of 1 means all identified metabolites in the pathway are upregulated, while −1 means all metabolites are downregulated. The length of the line segment represents the absolute value of the DA score, and the dot size indicates the number of metabolites in the pathway. Darker red shades indicate upregulation of the pathway, while darker blue shades indicate downregulation.
