Figure 15.

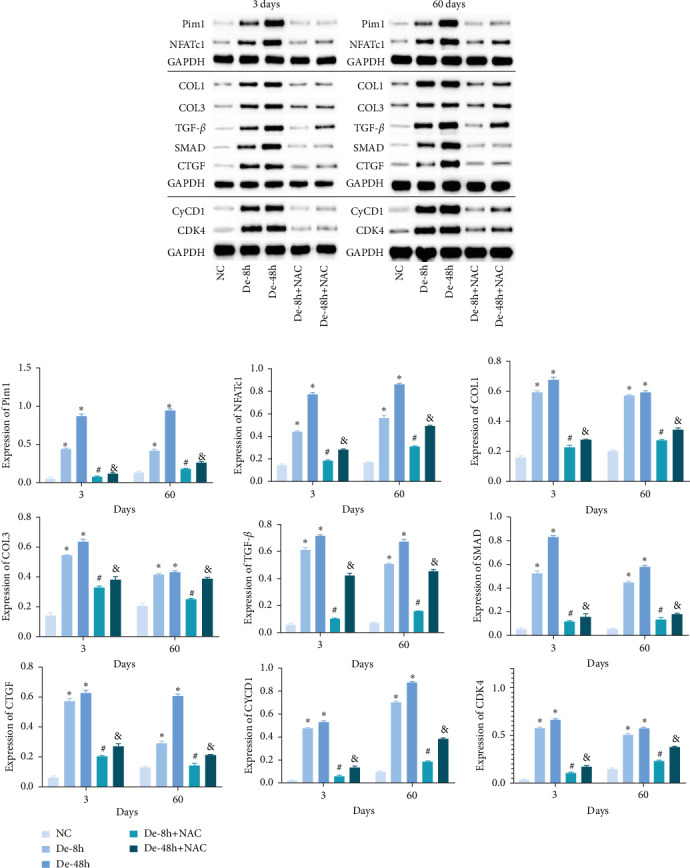
Related proteins downstream of JAK/STAT pathway in vivo detected using western blot. Data are shown as the mean ± SD (n = 10). ∗P < 0.05 vs. NC group; #P < 0.05 vs. De-8h group; and &P < 0.05 vs. De-48h group.

Related proteins downstream of JAK/STAT pathway in vivo detected using western blot. Data are shown as the mean ± SD (n = 10). ∗P < 0.05 vs. NC group; #P < 0.05 vs. De-8h group; and &P < 0.05 vs. De-48h group.