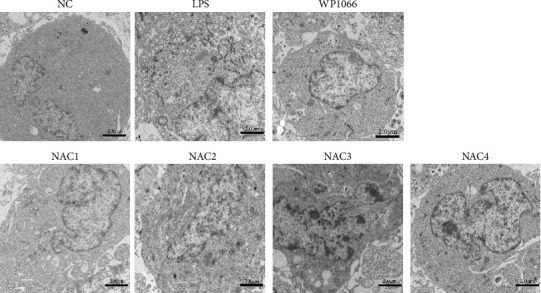
Figure 4.

Morphological changes in astrocytes after 48 hr of intervention with different concentrations of N-acetylcysteine (NAC) under a transmission electron microscope. NC, normal control group; lipopolysaccharide (LPS), 1 μg/mL LPS; NAC1, LPS + 5 mM; NAC2, LPS + 2.5 mM; NAC3, LPS + 1 mM; and NAC4, LPS + 0.5 mM. Scale bar = 2.0 μm; n = 3.
