
Figure 6.
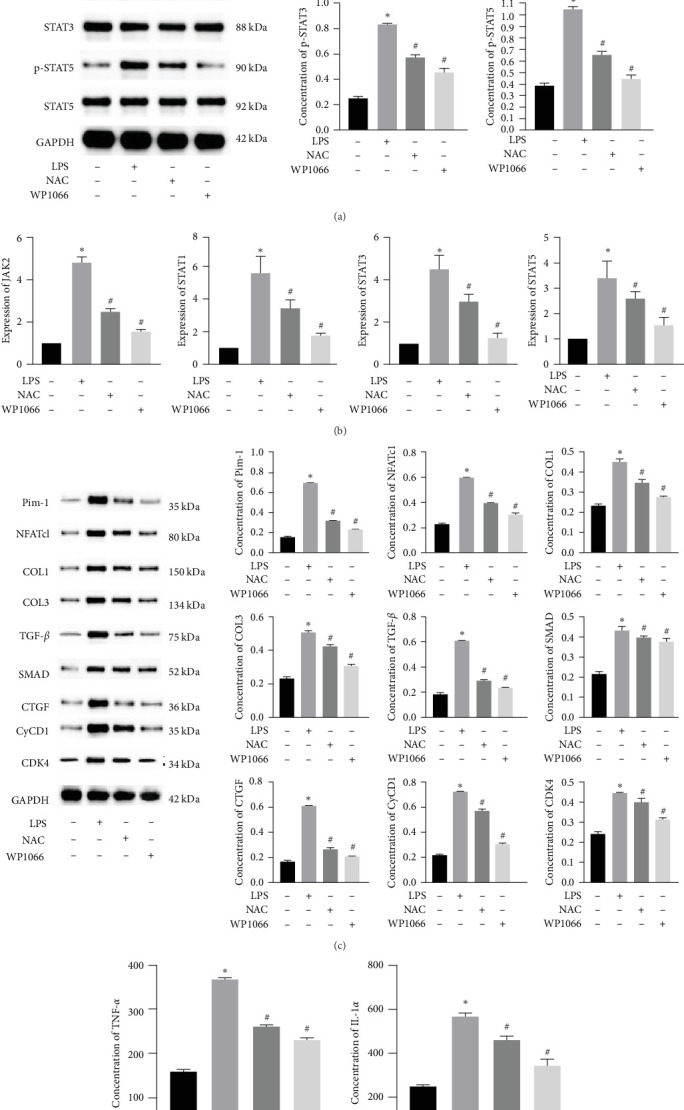
Effect of N-acetylcysteine on JAK/STAT pathway. (a) Phosphorylation level of major proteins (p-JAK2, p-STAT1, p-STAT3, and p-STAT5) on JAK/STAT pathway detected using western blotting. The quantities were normalized to total levels. (b) Expression of JAK2, STAT1, STAT3, and STAT5 measured using quantitative reverse transcription-PCR. (c) Related proteins downstream of JAK/STAT pathway detected using western blotting. (d) Levels of IL-1α and TNF-α detected using ELISA. Data are shown as the mean ± SD (n = 3). ∗P < 0.05 vs. control group. #P < 0.05 vs. LPS group.