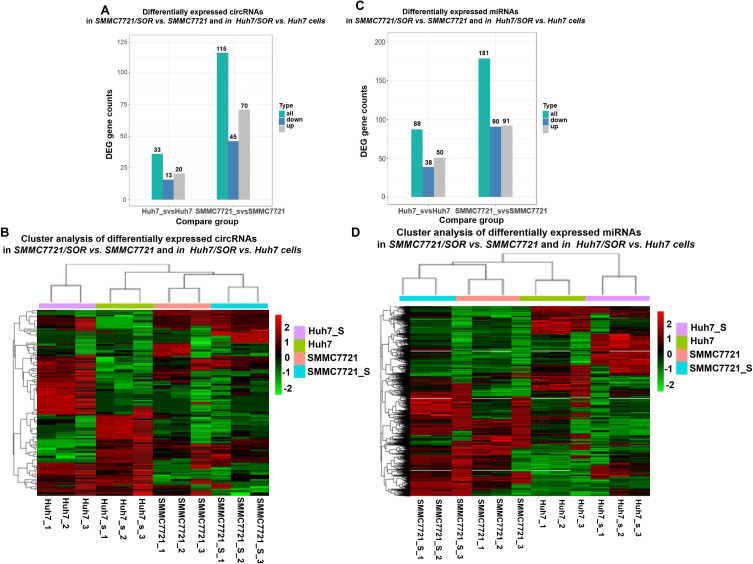
Figure 1.
The determination for DENs in sorafenib-resistant cells, compared to sorafenib-sensitive HCC cells. (A) The gene counts of differentially expressed circRNAs in SMMC7721/SOR vs SMMC7721 and in Huh7/SOR vs Huh7 cells. (B) Heat map depicting differentially expressed circRNAs was generated using R package. (C) The gene counts of differentially expressed miRNAs in SMMC7721/SOR vs SMMC7721 and in Huh7/SOR vs Huh7 cells. (D) Heat map depicting differentially expressed miRNAs was generated using R package. For the heat map in Figure 1, the horizontal axis represents the samples, and the vertical axis represents differential genes. The left side clusters genes based on their expression similarity, while the upper side clusters each sample based on their expression profile similarity. The expression level gradually increases from blue or green to red, and the number represents the relative expression level after homogenization.Fold Change≥1.0 and Padj<0.05. For Figure 1, the transcriptome sequencing was performed with three samples per group.

