Figure 5.
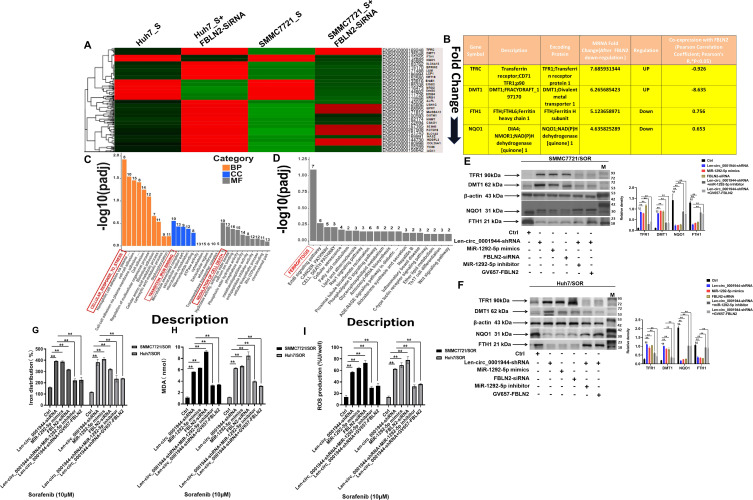
Circ_0001944 restrains cell ferroptosis by targeting the miR-1292-5p/FBLN2 axis. (A) A heatmap of hierarchical clustering showing the differentially expressed miRNAs in Huh7/SOR-FBLN2 silence vs Huh7/SOR and SMMC7721/SOR-FBLN2 silence vs SMMC7721 cells with three biological replicates per group (Fold Change≥2 and Padj<0.05). (B) The expression profile of DEGs in SMMC7721/SOR-FBLN2 silence cells. (C) The identification for GO function of these DEGs. (D) KEGG pathway enrichment for these differentially expressed mRNAs. The most 10 significant GO terms, as well as most 20 KEGG enrichment pathways are drawn as a bar chart; the horizontal axis in the figure represents the GO terms and KEGG pathways, and the vertical axis represents the significance level of pathway enrichment, with higher values indicating greater significance. The red box was defined in the highest bar column to highlight the GO terms and KEGG pathways associated with these genes. (E and F) Huh7/SOR (E) and SMMC7721/SOR (F) cells were pre-transfected with Len-circ_0001944-shRNA, miR-1292-5p mimics, FBLN2-siRNA, miR-1292-5p inhibitor and GV657-FBLN2 for 24h, and then were stimulated with sorafenib (10μM) for another 48h. The protein level of TFR1, DMT1, FTH1 and NQO1 were determined using Western blot assay. For Western blot assay, all of the data were manifested as the representatives (left) and the relative expression with means±SD (right) from three independent experiments. **P<0.01. (G–I) SMMC7721/SOR and Huh7/SOR cells were pre-treated with Len-circ_0001944-shRNA, miR-1292-5p mimics, FBLN2-siRNA, miR-1292-5p inhibitor and GV657-FBLN2 for 24h, and were stimulated with sorafenib (10μM) for another 48h. Intracellular levels of Fe2+(G), lipid peroxides (H) and ROS levels (I) in HCC cells were detected, respectively.**P<0.01. Data are shown as means±SD of three independent experiments.

