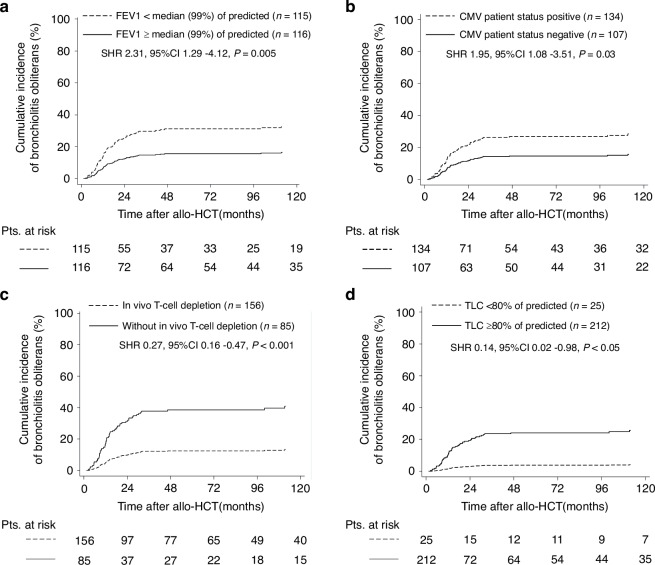
Fig. 2. Cumulative incidence of BOS by clinical factors and lung function tests associated with BOS in multivariate analysis.
Cumulative incidence curve represent bronchiolitis obliterans by (a) FEV1 ≥ or <median (99% of predicted), (b) CMV patient positivity or negativity, (c) GvHD prophylaxis with or without in vivo T-cell depletion and (d) TLC ≥ or < 80% of predicted in patients conditioned with myeloablative conditioning regimens prior allo-HCT. Statistical analysis was performed for Fine and Gray regression models in the presence of competing risks. FEV1 forced expiratory volume in 1 s., TLC total lung capacity, Pts patients, allo-HCT allogeneic hematopoietic cell transplantation, SHR subdistribution hazard ratio, CI confidence intervals.

