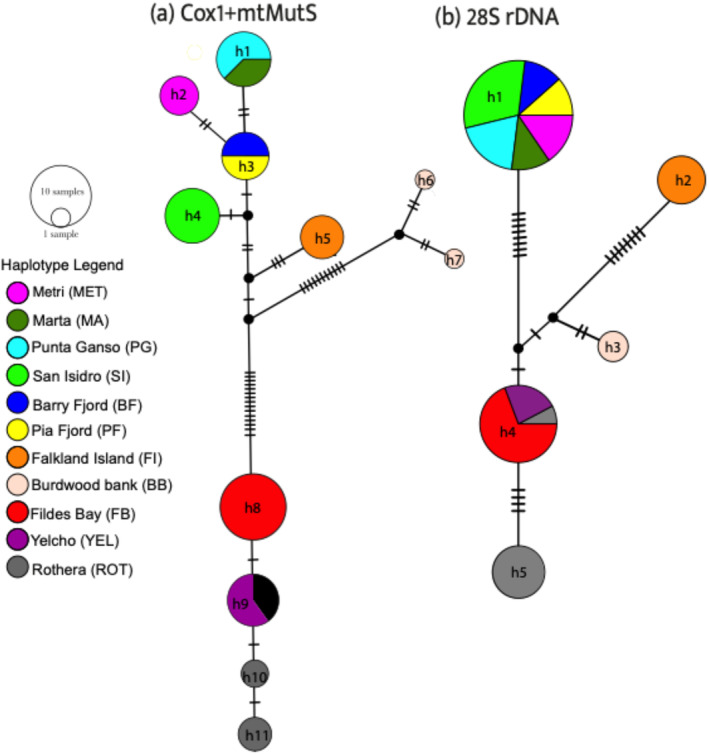
FIGURE 2.

Haplotype network, with haplotypes color‐coded to match their corresponding geographical distribution (a) inferred from the mtDNA (Cox1+mtMutS) and (b) inferred from 28S rDNA.

Haplotype network, with haplotypes color‐coded to match their corresponding geographical distribution (a) inferred from the mtDNA (Cox1+mtMutS) and (b) inferred from 28S rDNA.