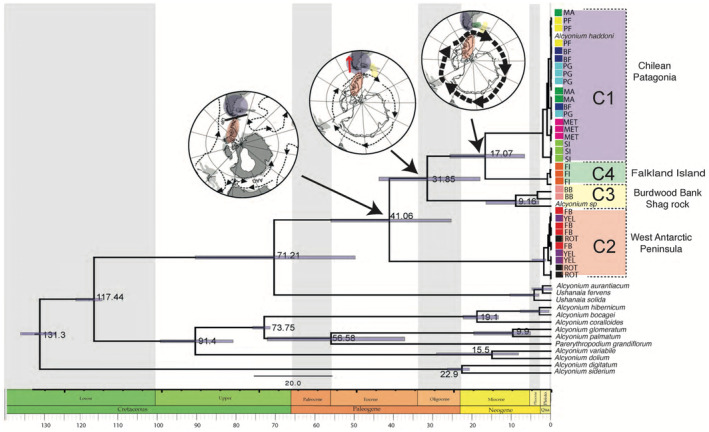
FIGURE 4.

Chronogram of the maximum clade credibility tree for the mtMuts dataset, estimated using a conservative mutation rate of 0.25% per million years. Bars at the nodes represent the 95% highest posterior density intervals, highlighting the uncertainty around estimated divergence times. The scale bar indicates time in millions of years. The accompanying maps illustrate the biogeographic implications of tectonic and oceanographic changes over the past 50 million years. Modified from Cantrill and Poole (2012).
