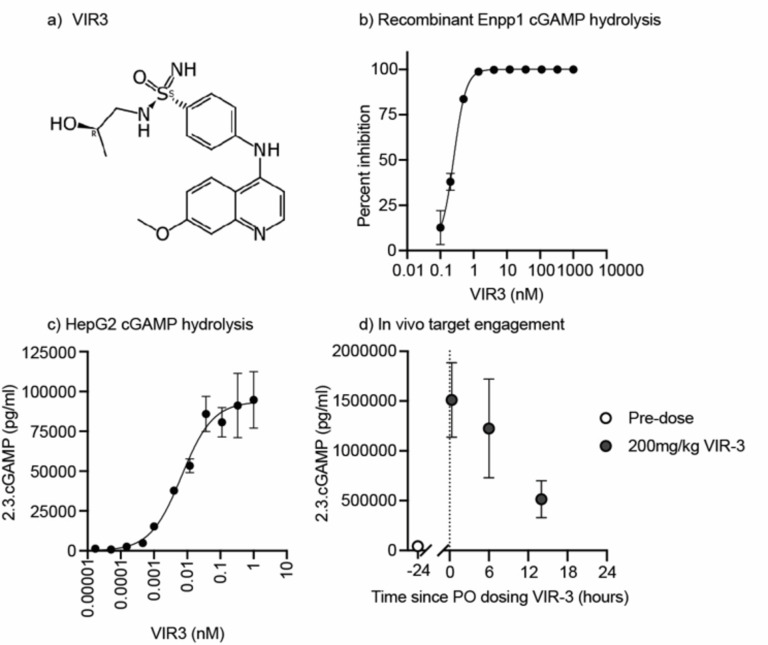
Fig. 4.
Development of VIR3 Enpp1 Inhibitor(a) Structure of VIR3. (b) Representative data from biochemical assay monitoring recombinant ENPP1 cGAMP hydrolysis activity and inhibition by VIR3. (c) Representative data from cellular assay monitoring cGAMP hydrolysis on HepG2 cells in the presence of VIR3. (d) In vivo target engagement was measured by administering 5ug of 2’3’-cGAMP IV to mice and then collecting blood samples 3 minutes later into a tube containing ENPP1 inhibitors. The level of cGAMP remaining the plasma at the time of collection was measured by ELISA both before VIR3 oral administration (open circles) or after (closed circles) (n = 3-5 mice per group, data is plotted as mean +/-SEM).

