Fig. 6.
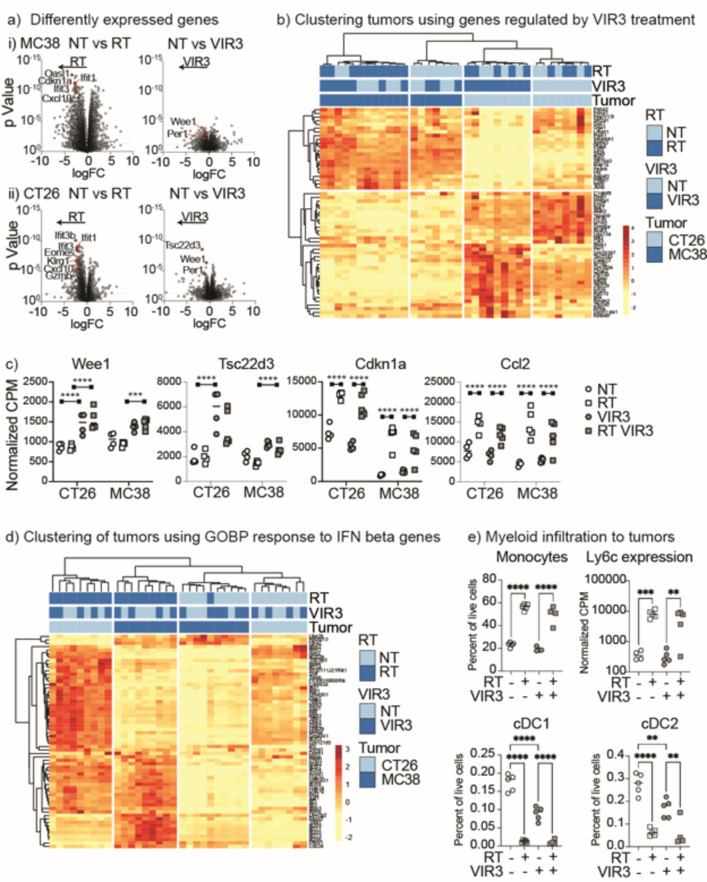
Impact of RT and VIR3 treatment on tumor gene expression. MC38 tumors were established in C57BL/6 mice and CT26 tumors were established in BALB/c mice. Mice were randomized to receive daily doses of VIR3 or vehicle by oral gavage starting on d13, and further randomized to no further treatment or 12 Gy focal RT to the tumor on d14. 4 days following radiation (d18) tumors were harvested and total gene expression in the tumors was analyzed by RNASeq, with 4 tumors for each treatment condition and tumor (32 total). (a) Volcano plots of differential gene expression shown as log fold change by pValue by treatment group. For (i) MC38 or (ii) CT26 tumors the graphs show differential gene expression due to RT alone, or VIR3 treatment alone. A selection of relevant genes are highlighted in red. (b) Expression of genes significantly regulated with FDR correction by VIR3 treatment in untreated (NT vs. VIR3) or irradiated tumors (RT vs. RT + VIR3) were used for cluster analysis. Blue colors indicate samples in each treatment group and the color scale yellow to red shows the degree of expression of each gene with unit variance scaling applied to each gene. (c) Expression of selected genes in each sample, by normalized CPM. Each symbol represents one tumor. (d) Expression of genes represented in the GOBP response to IFN beta genesets across samples. Blue colors indicate samples in each treatment group and the color scale yellow to red shows the degree of expression of each gene with unit variance scaling applied to each gene. (e) Flow cytometry of tumors treated as in a-d) to assess myeloid infiltration. Graphs show each cell type as a percent of all live cells in the tumor. Each symbol represents one tumor. Gene expression of Ly6c2 is also shown as a comparator, by normalized CPM. Each symbol represents one tumor. Key: * p < 0.05; ** p < 0.01; *** p < 0.001; **** p < 0.0001.

