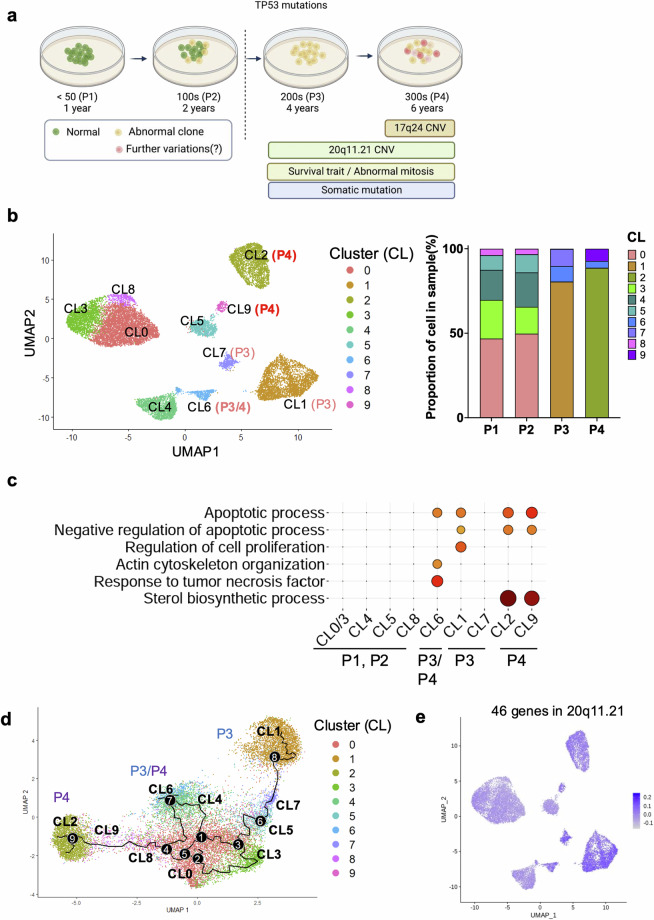
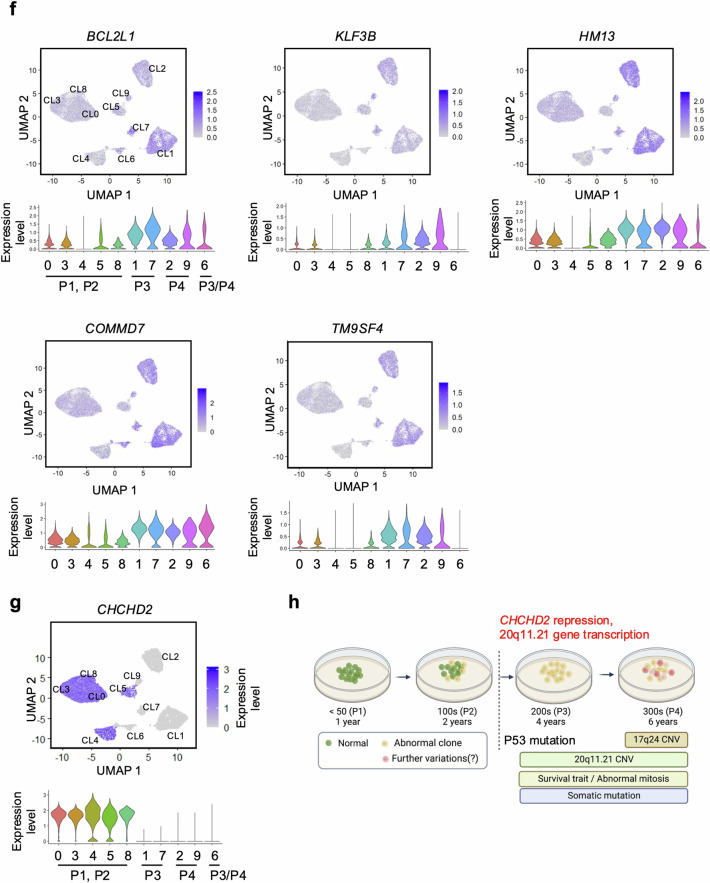
Fig. 3. Culture-adapted hESC cellular heterogeneity and transcriptome profiles.
a Scheme of isogenic pair hESCs and single-cell analysis considering the TP53 mutation status. b UMAP plot visualization of cultured hESCs (P1, P2, P3, and P4) colored according to 10 different transcriptionally distinct clusters (left panel); CL0, CL3, CL4, CL5 and CL8 for both P1 and P2 hESCs; CL1 and CL7 for P3 hESCs; CL2 and CL9 for P4 hESCs; and CL6 for both P3 and P4 hESCs. The right panel in Fig. 3b represents the composition of the clusters in each sample and the proportion of cells within each cluster. c GO terms enriched for each cluster based on differentially expressed genes. GO enrichment analysis was conducted via DAVID with a cutoff EASE score < 0.01. d Single-cell trajectory reconstructed by Monocle 3 for the four cultured hESCs. The trajectory indicates that P3 and P4 hESCs generated significant cellular heterogeneity from P1/P2 hESCs. Even between P3 and P4 hESCs, a high level of cellular divergence is shown. e Expression levels of 46 genes at 20q11.21 are indicated in each cell projected on the UMAP plot via the feature plot function. f Expression levels of BCL2L1, KLF3B, HM13, COMMD7, and TM9SF4 at 20q11.21 are indicated in each cell projected on the UMAP plot via the feature plot function. The VlnPlot below the UMAP plot shows the distribution of single-cell gene expression in each cluster. The y-axis of each panel represents the expression levels of the indicated genes. g Expression of CHCHD2 in Clusters 0, 3, 4, 5, and 8 for P1 and P2 hESCs. h Graphical representation of distinct changes in P3 and P4 hESCs, as determined by scRNA-seq (shown in red).


