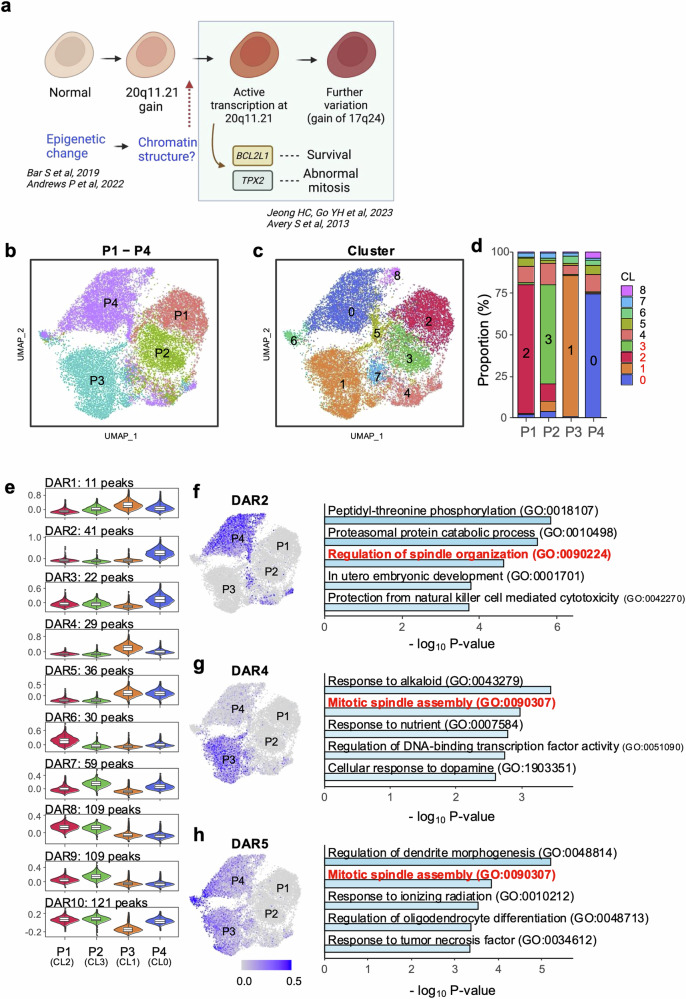
Fig. 4. Alteration of chromatin accessibility in culture-adapted variants.
a Scheme of chromatin structural alterations associated with culture-adapted variants. b Uniform manifold approximation and projection (UMAP) of scATAC-seq data from all the samples from P1 to P4. Each dot in the scatter plot represents single-cell chromatin accessibility. The four samples are color coded. c Clustering analysis based on chromatin accessibility. All the cells are grouped into 9 clusters and marked with numbers from 0 to 8. d The bar plot represents the proportion of a cluster for each sample. The major clusters are CL2 for P1, CL3 for P2, CL1 for P3, and CL0 for P4. These major clusters account for 80.6% of all cells. e Violin plots showing average open chromatin levels of differentially accessible regions (DARs) in major clusters. The y-axis represents the scaled average open chromatin levels of the DARs, which was calculated via the AddModuleScore() function. All DARs were clustered via k-means clustering with k = 10. The number of peaks belonging to a specific DAR are indicated. f–h Representative DARs corresponding to passages and Gene Ontology analysis of their target genes. UMAP shows the average level of open chromatin accessibility of the indicated DARs. The bar plot represents the top 5 Gene Ontology (GO) terms associated with putative target genes of the indicated DARs. The GO terms related to spindle assembly are marked in red. The p values of the enrichment were calculated via Metascape.

