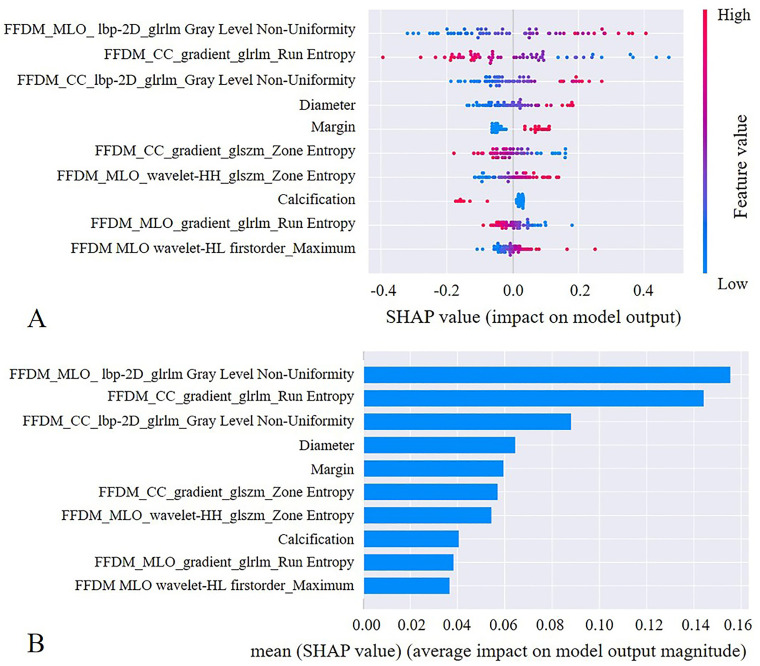
Figure 4.
The selected features of the combined model were evaluated by the SHAP method. The features are listed in descending order according to their contribution to the model. The top three largest contributors to the model were radiomics features, including GrayLevelNonUniformity on MLO view, RunEntropy on CC view, and GrayLevelNonUniformity on CC view, all of which represent intratumor heterogeneity. Mass diameter and margins ranked fourth and fifth, respectively, and also played an important role in the differentiation between PT and FA.

