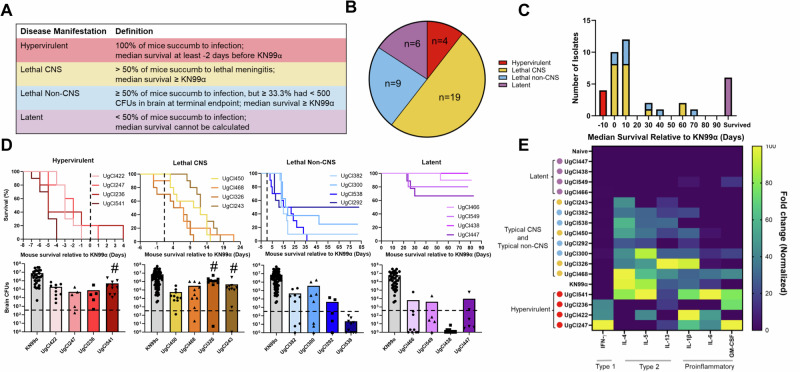
Fig. 2. Mice infected with clinical isolates showed four distinct disease manifestations that associated with immune response.
5–10 mice were infected with each clinical isolate and monitored for 100 days. A Disease manifestation was categorized based on survival relative to KN99α controls and CFUs in the brain. B Lethal CNS was the most prevalent disease manifestation, followed by lethal non-CNS, then latent, with the hypervirulent manifestation accounting for 10% of isolates. C Histogram displaying the median survival of the 38 clinical isolates relative to KN99α. Color codes as in (B). D Top panel: four representative isolates are shown for each disease manifestation. The survival curves were normalized to an infection-matched KN99α control with the black dotted line indicating KN99α median survival (n = 5–10 mice). Bottom panel: Mouse CFUs in brains at terminal endpoint, or at 100 days post infection for latent isolates. Significance was determined using Kruskal–Wallis nonparametric test with Dunn’s multiple comparison correction (n = 5–10 mice; exact p-values from left to right; Hypervirulent: 0.0045, 0.0050, 0.0020, Typical CNS: <0.0001, 0.0024, Typical Non-CNS: 0.0006, 0.0067, 0.0039, <0.0001, Latent: <0.0001, 0.0207, <0.0001, 0.0182). # indicates isolates that are not significantly different from the KN99α control. E Normalized and scaled cytokine fold-change data. The fold-change from an uninfected control mouse was determined for each cytokine. The heatmap was populated with cytokines that had a significant increase compared to the naïve control. Significance was determined using a Kruskal–Wallis nonparametric test without Dunn’s multiple comparison correction. Sample clustering was performed using an average clustering linkage method and Euclidean distance measurement63. The clustered heatmap was normalized by column and the highest value for each cytokine was assigned a value of 100 and the lowest amount 0. Yellow indicates the greatest fold-change from naïve control for that cytokine and blue indicates the lowest fold-change. Four representative samples from each disease manifestation are shown. Latent isolates (purple) clustered with the uninfected control and showed a mostly undetectable immune response. Lethal CNS (yellow) and lethal non-CNS (blue) isolates showed a type-2 immune response, with increases in IL-4, IL-5, and IL-13, and clustered with KN99α. Hypervirulent isolates (red) showed an increase in the type-1 cytokine IFNγ and/or the proinflammatory cytokines, IL-1β, IL-6, and GM-CSF. Source data are provided as a Source Data file.

