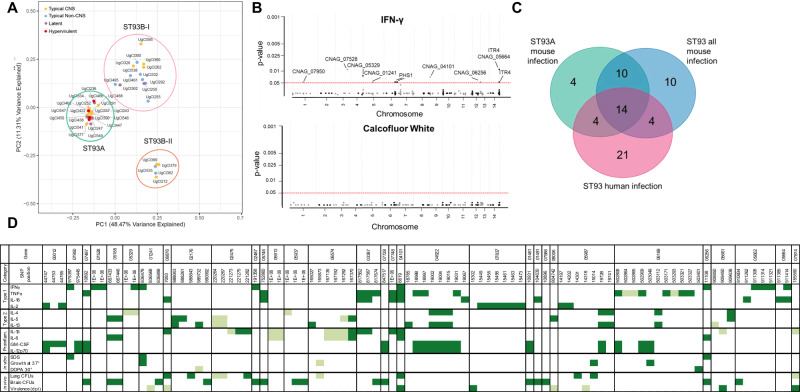
Fig. 4. Population structure and SNPs associate with disease manifestation.
A The first two principal components based on the 652 variants predicted to influence gene regulation or protein structure. Three clusters were supported using K-means clustering. Cluster names are based on Gerstein et al. 20. Disease manifestation is indicated with a colored dot. Hypervirulent isolates (red) were significantly associated with ST93A (P = 0.0183), lethal CNS isolates (yellow) with ST93A (P = 0.0214), non-CNS isolates (blue) with ST93B-I (P = 0.0131), and latent isolates (purple) had a non-significant trend towards ST93A (P = 0.1353). Significance was determined using a two-sided Chi-squared test comparing expected versus observed values. B GWAS results for a trait (IFNγ) with multiple significant associations (Top Panel) and a trait with no statistically significant associatons (Calcofluor white, Bottom Panel). The ordinal categorical variables were analyzed with a proportional odds logistic mixed model and the quantitative variables were analyzed using a mixed linear model. Significant variants were identified by likelihood ratio test P values < 0.05 after a Bonferroni correction. Each dot represents a SNP, arranged by chromosome; significant SNPs are lableled with the gene name. C Venn diagram comparing the number of genes with significantly identified SNPs in the human GWAS20, the ST93 all mouse GWAS, and the ST93A mouse GWAS. 14 genes overlapped across all three GWAS studies. D Significant SNPs from the ST93A GWAS are arranged by chromosome order and colored for significant variants. A lighter color indicates differences from the H99 genome associated with a decrease in the trait whereas a darker color indicates variants associated with an increase in that phenotype.

