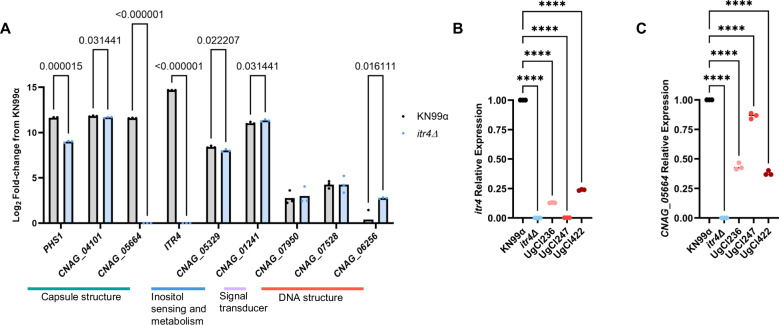
Fig. 7. ITR4 is downregulated in clinical isolates with SNPs in ITR4.
A Cells were grown in media supplemented with dextrose and inositol and RNA-seq was performed to compare transcription differences between KN99α and itr4Δ. Significance was determined using multiple unpaired T-tests with two stage linear step-up (n = 3 biological replicates; from left to right: p = 0.000015; p = 0.031441; p < 0.000001; p < 0.000001; p = 0.022207; p = 0.031441; p = 0.016111). B qPCR showing the relative expression of ITR4 in KN99α, itr4Δ and three hypervirulent clinical isolates that have SNPs in ITR4. Significance was determined using a one-way ANOVA (n = 3 biological replicates; p values, from left to right: P < 0.0001, P < 0.0001, P < 0.0001, P < 0.0001). C qPCR showing the relative expression of CNAG_05664 in KN99α, itr4Δ and three hypervirulent clinical isolates that have SNPs in ITR4 (n = 3 biological replicates; from left to right: P < 0.0001, P < 0.0001, P < 0.0001, P < 0.0001). Significance was determined using a one-way ANOVA. Source data are provided as a Source Data file. (****P < 0.0001).

