Figure 5.
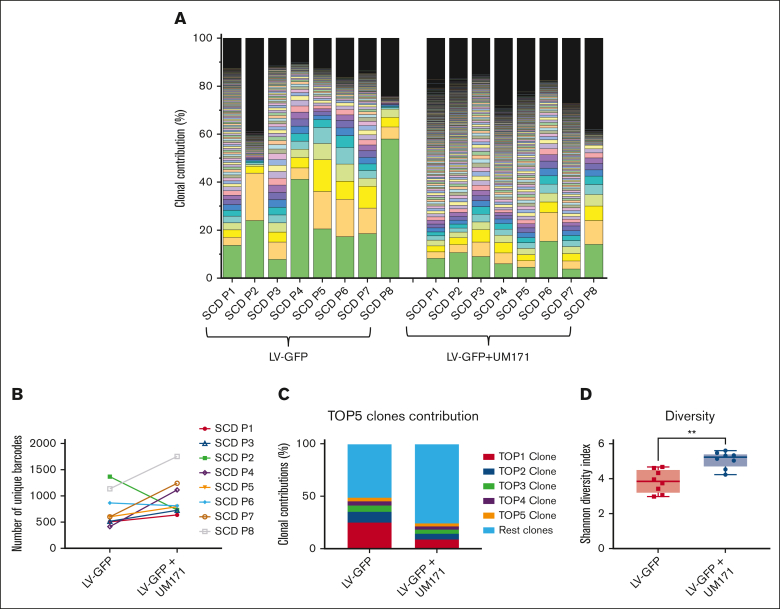
Effect of UM171 on clonality of barcoded engrafted BM cells. (A) Distribution of barcode frequencies detected in BM cells from transplanted NBSGW mice. Each color represents a distinct barcode. (B) Assessment of the number of unique clones from NBSGW mouse BM cells transplanted with CD34+ cells from different patients with SCD (noted P1-P8). Each data point represents an individual mouse transplanted with different patient’s cells. (C) The percentage of contributions of top 5 clones to engrafted BM harvested from transplanted mouse. (D) Shannon diversity index of barcodes from transplanted BM cells. Data represent mean ± SD, n = 8. ∗∗P < .01.

