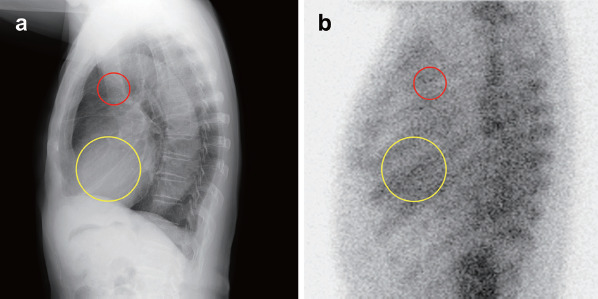
Figure 1 Lateral chest radiograph and lateral PYP images of the same patient.
Semi-quantitative H/M ratio on a lateral PYP image (b) was calculated using the regions of interest drawn around the heart (yellow circles) and around the superior mediastinum (ascending aorta: red circles) as shown in these figures, both of which were positioned without including the adjacent sternum and vertebral body.