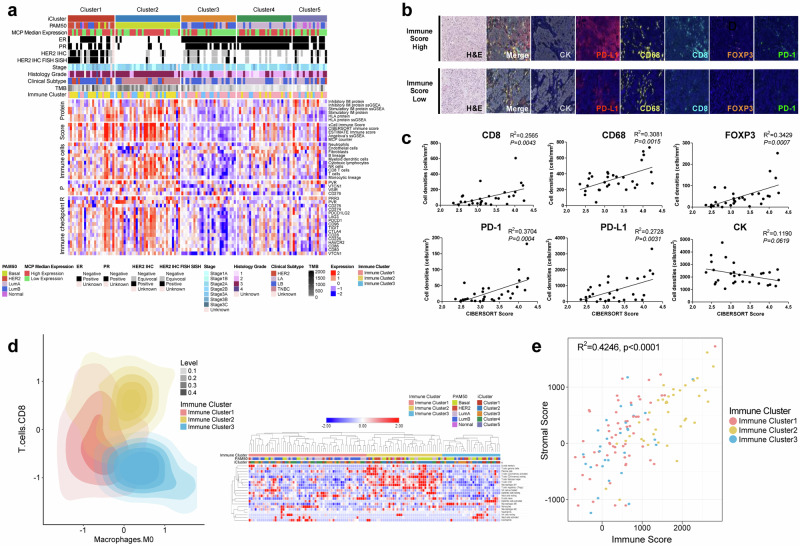
Fig. 4. Immunological landscape of early-onset Korean breast cancer.
a Heatmap showing the wide range of expression levels for immune-related features in each integrative molecular cluster. Protein-derived signatures for immune modulator gene sets are depicted in the top panel. Z scores of RNA-based immune signatures from xCell, CIBERSORT, ESTIMATE, gene sets from Angelova, and the MCP counter are shown in the second data panel. The third to fifth data panels show log2 ratios for normalized RNA-seq and proteomics data (the phosphoprotein is the median for all sites on a given protein) for immune cells and immune checkpoint targets, such as CD276, TIGIT, LAG3, and CTLA4. MCP median expression: ER: pathological staining of estrogen receptor, PR: pathological staining of progesterone receptor. b Multiplex imaging portrays the immune microenvironment of the tumor. The upper and lower panels represent samples that correspond to high and low computational immune scores, respectively. The samples were probed for CK (cytokeratin), PD-L1, CD68, CD8, FOXP-3, and PD-1. The morphological features are indicated by H&E staining. c Graphs depict the linear regression for correlations between cell counts per total area (cells/mm2) of each patient from all available ROIs for multiplex imaging probes and the CIBERSORT absolute immune score. *P < 0.05 d YBC samples are classified into immune-hot (yellow), immune-intermediate (pink), and immune-cold (blue) groups. The heatmap on the right illustrates various immune components (y-axis) as per the immune clusters. e Collinearity between immune and stromal scores in early-onset breast cancer. The scatter plot shows the relationship between the computational immune score (x-axis) and the stromal score (y-axis), with colors corresponding to the three different immune clusters. Spearman rank correlation coefficient analysis of the immune score (x-axis) and stromal score (y-axis) for immune clusters 1 ~ 3 (R2 = 0.4246, p < 0.0001).

