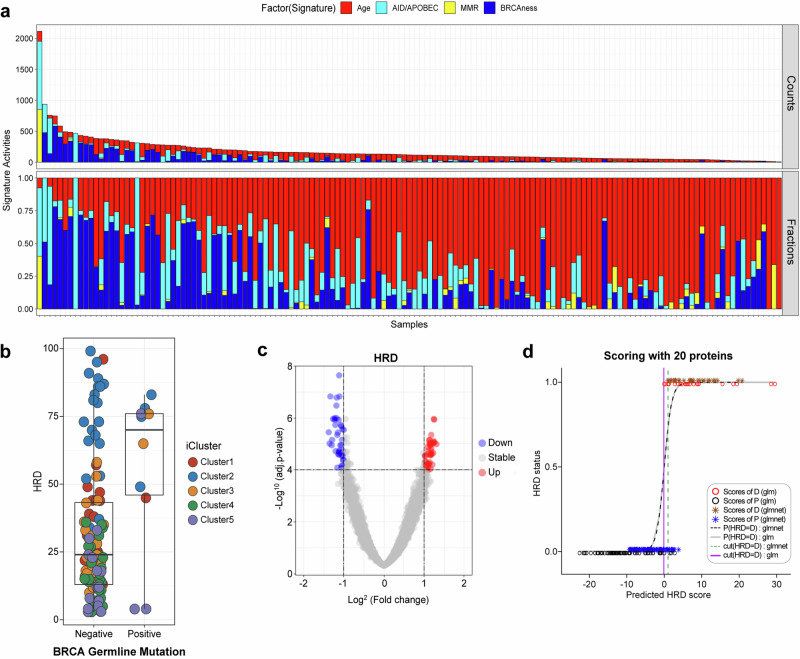
Fig. 5. Proteogenomic analysis of homologous recombination-deficient YBC.
a Mutational signature in early-onset breast cancer displaying the quantity (upper) and proportion (lower) of somatic mutations per sample belonging to each mutational signature. These include aging (red), APOBEC (cyan blue), mismatch repair defects (MMR, yellow), and BRCAness (blue) signatures. b Relationship between the homologous recombination defect (HRD) index and BRCA germline mutations. Germline BRCA mutations have a limited correlation with the degree of HRD. c Identification of protein elements that are highly correlated with the degree of HRD in breast cancer samples. d Predictive accuracy of different scoring methods in forecasting HRD status on the basis of scores derived from 20 proteins associated with HRDness. The data are presented using two different modeling techniques: a generalized linear model and elastic net regularization. The x-axis represents the predicted HRD score values for each sample. The y-axis indicates HRD status, with 0 representing non-HRD (HRP) and 1 representing HRD. Scores of D, P (glm): scores derived from the generalized linear model for Dataset D or P, represented by red and black circles. Scores of D, P (glmnet): scores derived from the elastic net model for Dataset D or P, represented by brown and blue asterisks. P (HRD = D): glm/glmnet: predicted logistic probability of HRD using the glm or glmnet model, depicted by a gray solid line or black dashed line. Threshold (HRD = D): glm/glmnet: The threshold value for HRD is D using the glm or glmnet model, shown as a solid or dotted line estimated from the maximum ROC. The thresholds help distinguish between HRD and non-HRD samples, providing a visual comparison of the predictive power and accuracy of the glm and glmnet models.

