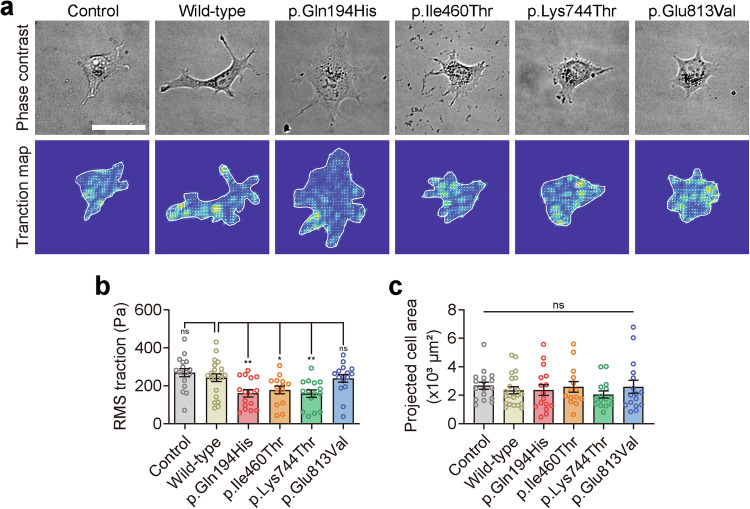
Fig. 7. Traction stress maps of wild-type or mutant MYH1-expressing cells.
a Representative phase contrast (top panel) and traction field images (bottom panel) of COS-7 cells adhered to an elastic polyacrylamide gel coated with fibronectin (Young’s modulus of 20 kPa with a Poisson’s ratio of 0.48). Scale bar = 50 µm. b Projected cell area measured in cells overexpressing wild-type or mutant MYH1. c Root mean square (RMS) traction measured in cells overexpressing wild-type or mutant MYH1. The data are presented as the means ± SEMs. Statistical comparisons were performed using two-way ANOVA with Bonferroni correction for multiple comparisons in (b) and (c). ns not significant; *P < 0.05; **P < 0.01.

