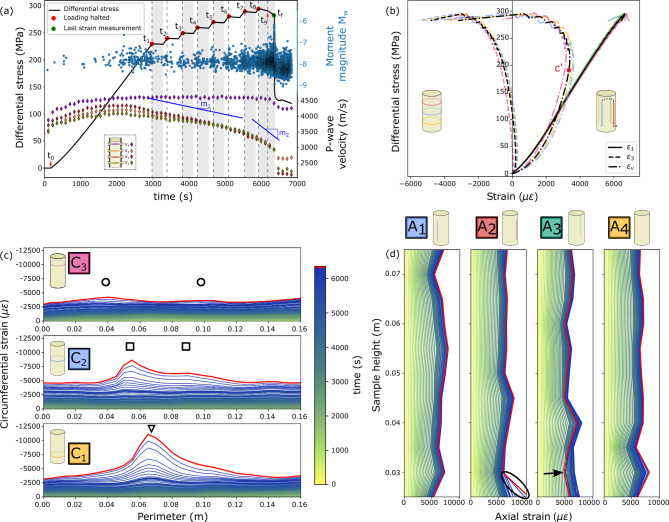
Fig. 1.
(a) Observed differential stress response, temporal evolution of AE magnitudes (blue circles) and P-wave velocity during the test. Isolated P-wave velocity plot is provided in the Section 6 of Supplementary Material, and a zoom of the final relaxation phase is provided in Section 2 of the Supplementary Material. (b) Average of the implemented four axial and three circumferential DSS segments and the volumetric strain. Colour code is given in the small sample scheme and in the squares in panels (c) and (d). (c) Distributed circumferential strain at the three implemented segments: lower (yellow, ), middle (blue, ) and upper (purple, ) (see Fig. 8). Regions of localized strain are marked with triangles, squares, and circles in the lower, middle, and upper segments, respectively. (d) Distributed axial strain at the four implemented segments: first (, blue), second (, red), third (, green) and fourth (, yellow). The colormap indicates the time, with the last measurement in red.

