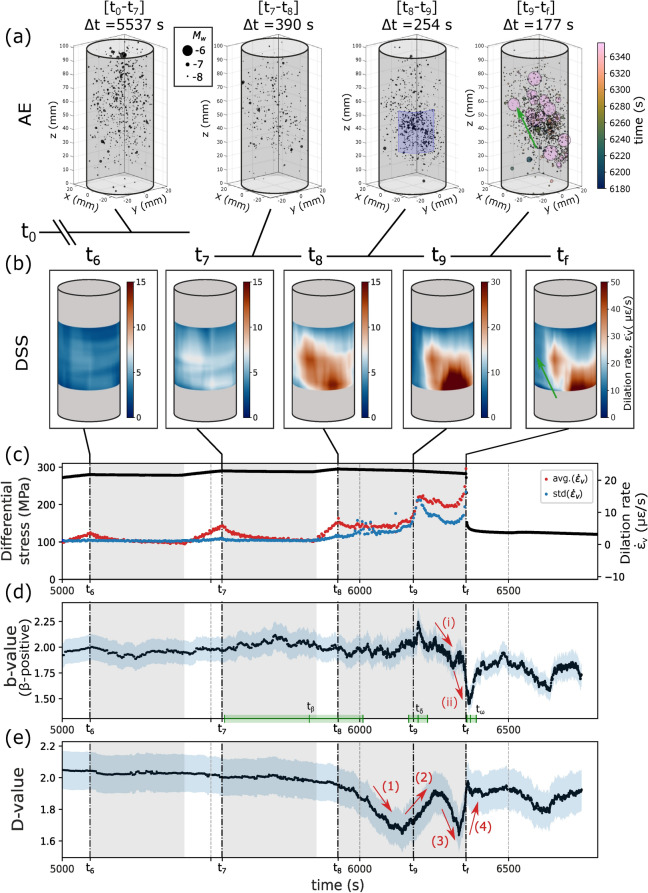
Fig. 3.
(a) Spatial distribution of the seismic catalogue located prior to failure. The sizes of the markers are proportional to the of the AE events. The events in the moments before failure ( to ) are colored by their timing. A larger version of this sub-figure can be found in Section 4 of the Supplementary Material. (b) Virtual reproduction of the volumetric strain rate, which was linearly interpolated and superimposed on the surface following Salazar Vásquez et. al.37. (c) Comparison of average volumetric strain rate (red dots), standard deviation of the distributed volumetric strain rate (blue dots), and the differential stress (black line) leading up to failure. Volumetric strain rate (=+2) was calculated from the average of the axial and circumferential strain rates shown in Fig. 2. (d) Fluctuations of the b-value during the experiment. Light blue region represent the standard error calculated using Eq. 5. We have selected three sub-catalogues (, , and ) to illustrate their duration, which are represented by the green bars. (e) Spatial clustering of the AEs using the D-value. The localization and delocalization of AEs are indicated by red arrows. The b- and D-values were calculated using a running sub-catalogue of 480 events (see Section AE data processing).

