Fig. 5.
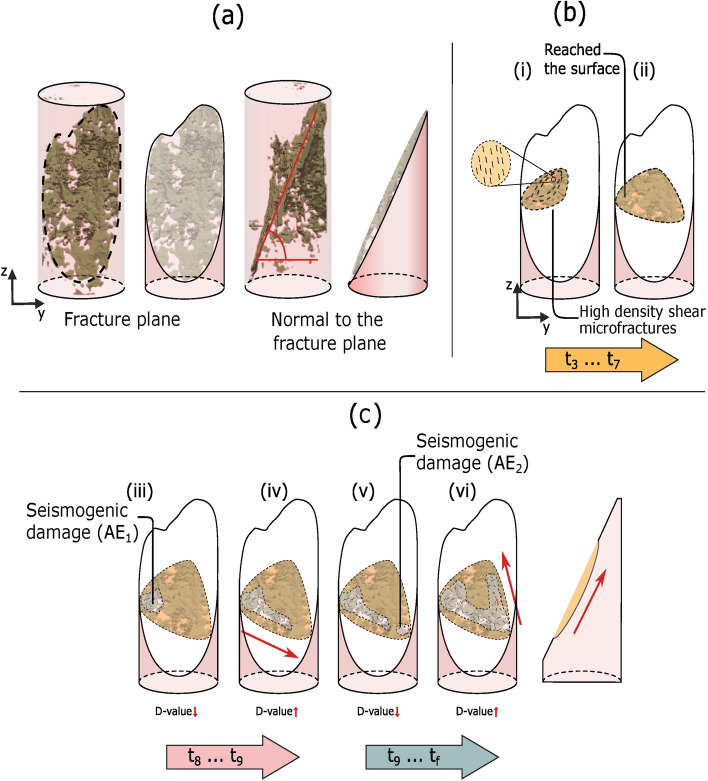
Schematic of the hypothetical damage initiation and subsequent fracture propagation. Cross-sections represent a plane parallel to the macro-fracture that caused the failure. (a) Two XR-CT cross sections obtained post-test: parallel and perpendicular to the macro-fracture plane. The evolution of the localized preparatory damage shown in this figure was also reflected in the spatial-temporal variations of the P-wave velocity (Fig. 1a). (b) The nucleation of a zone hosting a large numbers of shear microfractures (preparatory damage) is represented by the light orange zone. (c) Seismogenic damage is indicated by the zones showing the macro-fracture, which originated near the boundary of the sample and propagated to the opposite side. Dynamic rupture occurred when the length of the preparatory damage exceeded a certain threshold, which may have resulted in an energy balance that produced unstable fracture growth (e.g., 53).

