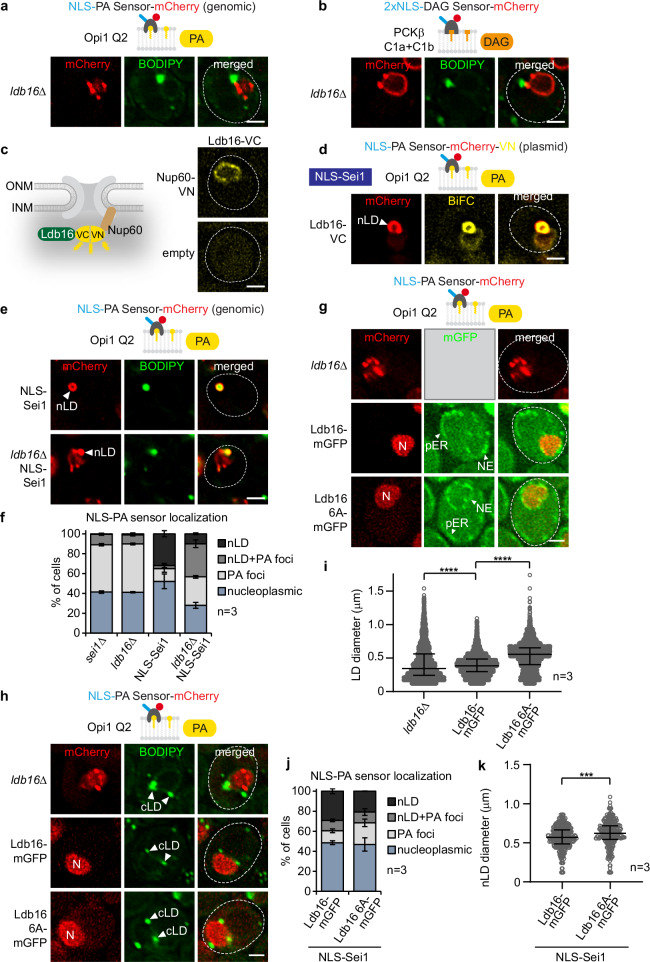
Fig. 6. Ldb16’s hydroxyl residues govern proper cellular TAG accumulation but not PA metabolism at the INM.
a Live imaging of ldb16∆ cells expressing plasmid-based NLS-PA-mCherry sensor. BODIPY stains LDs. Scale bar, 2 μm. b Live imaging of ldb16∆ cells expressing plasmid-based 2xNLS-DAG-mCherry sensor and stained with BODIPY. Scale bar, 2 μm. c Experimental design for BiFC (bimolecular fluorescence complementation). VN, VC, complementary Venus fragments. Live imaging of wild-type cells expressing Ldb16 fused with VC and Nup60 fused with VN. Ldb16 is expressed from the GPD promoter. Nup60 is a basket nucleoporin, exclusively localized on the nuclear face of the nuclear pore complex. Empty vector is used as a control. Scale bar, 2 µm. d Live imaging of sei1∆ cells expressing plasmid-based NLS-PA-mCherry-VN, LDB16-VC and NLS-SEI1 constructs. Ldb16 is expressed from the GPD promoter. nLD, nuclear lipid droplet. Scale bar, 2 μm. e Live imaging of sei1∆ or sei1∆ ldb16∆ cells expressing plasmid-based mGFP-NLS-SEI1 and genomically integrated NLS-PA-mCherry sensor. Cells are stained with BODIPY. nLD, nuclear lipid droplet. Scale bar, 2 μm. f Quantification of NLS-PA-mCherry sensor localization in (e). Mean value and standard deviation indicated. n, number of biological replicates. More than 380 cells analysed for each condition. Source data are provided as a Source Data file. g Live imaging of ldb16∆ cells expressing plasmid-based NLS-PA-mCherry sensor and indicated plasmid-based LDB16-mGFP constructs from the ADH1 promoter. N, nucleus. Scale bar, 2 μm. h Live imaging of ldb16∆ cells expressing plasmid-based NLS-PA-mCherry sensor and indicated plasmid-based LDB16-mGFP constructs expressed from the ADH1 promoter. BODIPY stains LDs. Note that even though cells contain Ldb16-mGFP, the green BODIPY fluorescence signal is significantly brighter, hence Ldb16 fluorescence remains undetectable when the settings for BODIPY imaging are applied. cLD, cytoplasmic lipid droplet. Scale bar, 2 μm. i Automated quantification of cellular LD diameter in (h). n, number of biological replicates. Median and interquartile range indicated. P value (****P < 0.0001) determined by two-sided Kolmogorov-Smirnov test. Source data are provided as a Source Data file. j Quantification of NLS-PA-mCherry sensor localization in sei1∆ ldb16∆ cells expressing genomically integrated NLS-PA-mCherry, plasmid-based mGFP-NLS-SEI1 and genomically integrated LDB16-mGFP constructs. LDB16 was expressed from the ADH1 promoter. Mean value and standard deviation indicated. n, number of biological replicates. 611 cells for LDB16-mGFP and 663 cells for ldb16 6A-mGFP were analysed. Source data are provided as a Source Data file. k Automated quantification of nLD diameter in sei1∆ ldb16∆ cells expressing genomically integrated NLS-PA-mCherry, plasmid-based mGFP-NLS-SEI1 and genomically integrated LDB16-mGFP constructs. LDB16 was expressed from the ADH1 promoter. n, number of biological replicates. Median and interquartile range indicated. P value (***P < 0.001) was determined by two-sided Kolmogorov-Smirnov test. 302 nLDs for LDB16-mGFP and 252 nLDs for ldb16 6A-mGFP were analysed. Source data are provided as a Source Data file.

