
Fig. 6.
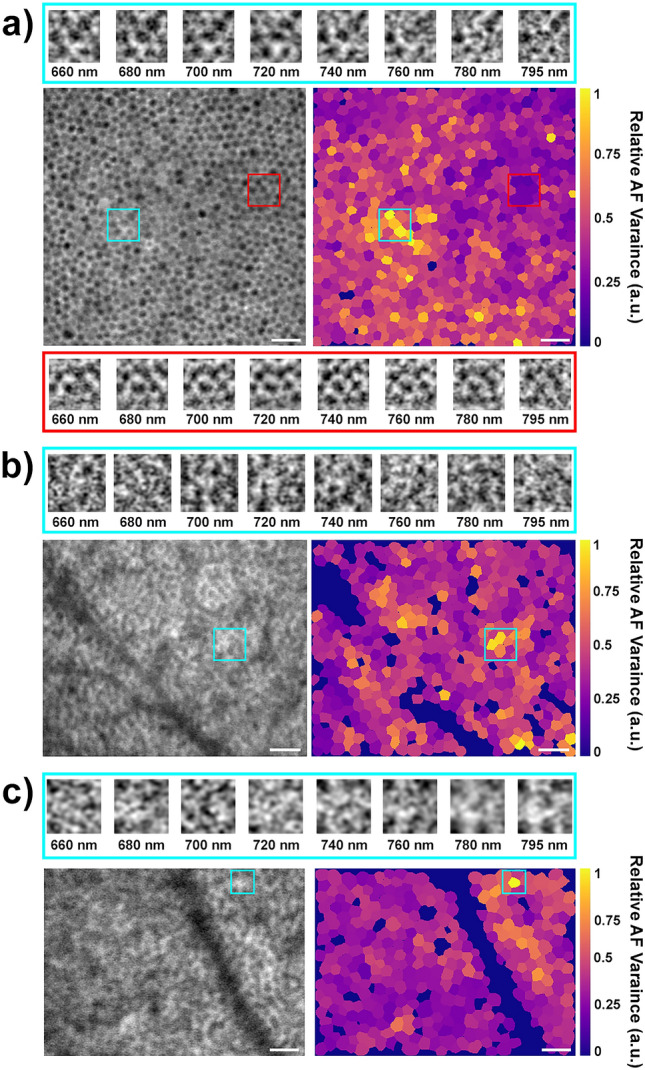
AF variance across the 3 age groups. Each age group shows the high contrast average image of the RPE cells on the left and the AF variance heatmap on the right. (a) shows the RPE from a 20 y.o. female at the fovea. The cyan box represents a group of cells that show relatively high AF variance within the image whereas the red box shows a group of cells with relatively low AF variance. A zoomed-in-view of those cells can be seen within the rectangle with its corresponding color. (b) Shows the RPE from a 53 y.o. male at  temporal and (c) shows the RPE from a 64 y.o. female also at
  temporal. The scale bars represent 50
  m.
m.