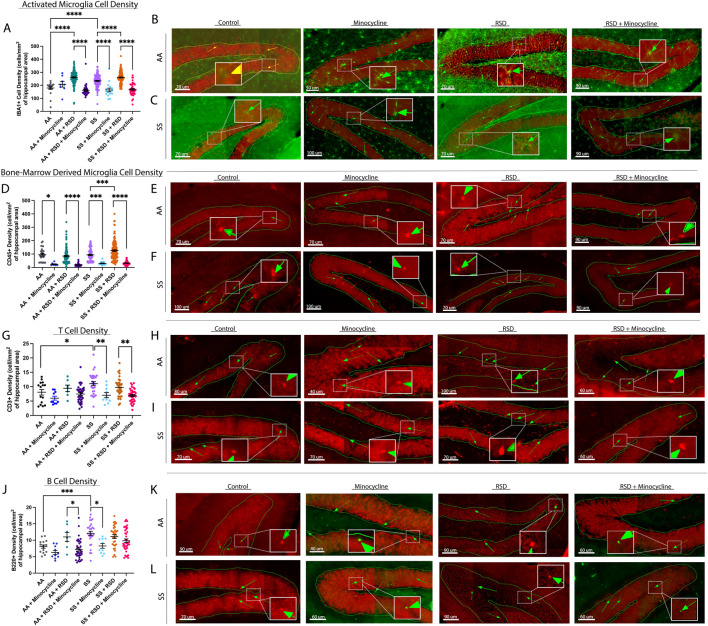
FIGURE 2.
Sickle cell mice exposed to RSD have a higher density of activated microglia and B and T cell infiltrates in the hippocampus while minocycline reduces the density of immune cell infiltrates. (A) IBA-1+ activated microglia cell density. (B) Immunohistochemistry images showing IBA-1+ activated microglia in AA control mice (n = 10 sections), AA mice treated with minocycline (n = 8 sections), AA mice exposed to RSD (n = 27 sections), and AA mice exposed to RSD and treated with minocycline (n = 40 sections). (C) Immunohistochemistry images showing IBA-1+ activated microglia in SS control mice (n = 22 sections), SS mice treated with minocycline (n = 18 sections), SS mice exposed to RSD (n = 41 sections), and SS mice exposed to RSD and treated with minocycline (n = 49 sections). (D) CD45+ “bone-marrow-derived” microglia cell density. (E) Immunohistochemistry images showing CD45+ bone-marrow microglia in AA control mice (n = 10 sections), AA mice treated with minocycline (n = 8 sections), AA mice exposed to RSD (n = 27 sections), and AA mice exposed to RSD and treated with minocycline (n = 40 sections). (F) Immunohistochemistry images showing CD45+ bone-marrow microglia in SS control mice (n = 22 sections), SS mice treated with minocycline (n = 18 sections), SS mice exposed to RSD (n = 41 sections), and SS mice exposed to RSD and treated with minocycline (n = 49 sections). (G) B220 + B cell density. (H) Immunohistochemistry images showing B220 + B cells in AA control mice (n = 16 sections), AA mice treated with minocycline (n = 10 sections), AA mice exposed to RSD (n = 8 sections), and AA mice exposed to RSD and treated with minocycline (n = 36 sections). (I) Immunohistochemistry showing B220+ B cells in SS control mice (n = 32 sections), SS mice treated with minocycline (n = 10 sections), SS mice exposed to RSD (n = 32 sections), and SS mice exposed to RSD and treated with minocycline (n = 40 sections). (J) CD3+ T cell density. (K) Immunohistochemistry images showing CD3+ T cells in AA control mice (n = 16 sections), AA mice treated with minocycline (n = 10 sections), AA mice exposed to RSD (n = 8 sections), and AA mice exposed to RSD and treated with minocycline (n = 36 sections). (L) Immunohistochemistry images showing CD3+ T cells in SS control mice (n = 32 sections), SS mice treated with minocycline (n = 10 sections), SS mice exposed to RSD (n = 32 sections), and SS mice exposed to RSD and treated with minocycline (n = 40 sections). Cell density was compared between groups with a one-way ANOVA and Fisher’s LSD multiple comparisons test. *p < 0.05, **p < 0.01, ***p < 0.001. Data are presented as mean ± SEM. The “n” in brackets after each group represents the total number of hippocampal brain tissue sections evaluated.

