FIGURE 3.
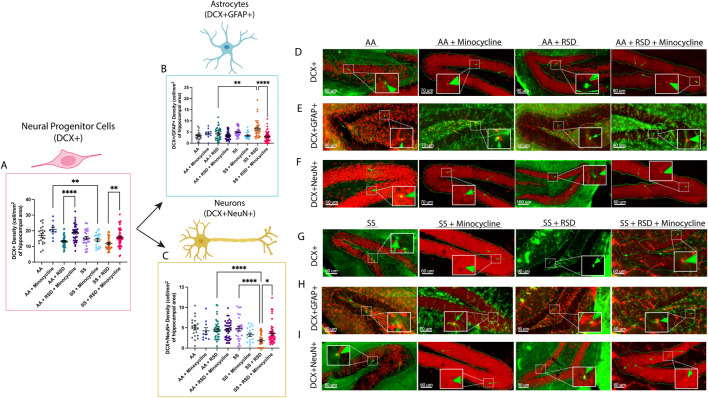
Sickle cell mice exposed to RSD have a higher density of DCX+GFAP+ astrocytes while having decreased densities of DCX+ neural progenitor cells and DCX+NeuN+ neurons in the hippocampus. (A) DCX+ neural progenitor cell density. (B) DCX+GFAP+ astrocyte cell density. (C) DCX+NeuN+ neuron cell density (D) Immunohistochemistry images showing DCX+ neural progenitor cells in AA control mice (n = 21 sections), AA mice treated with minocycline (n = 10 sections), AA mice exposed to RSD (n = 40 sections), and AA mice exposed to RSD and treated with minocycline (n = 41 sections). (E) Immunohistochemistry images showing DCX+GFAP+ astrocytes in AA control mice (n = 21 sections), AA mice treated with minocycline (n = 10 sections), AA mice exposed to RSD (n = 40 sections), and AA mice exposed to RSD and treated with minocycline (n = 41 sections). (F) Immunohistochemistry images showing DCX+NeuN+ neurons cells in AA control mice (n = 21 sections), AA mice treated with minocycline (n = 10 sections), AA mice exposed to RSD (n = 40 sections), and AA mice exposed to RSD and treated with minocycline (n = 41 sections). (G) Immunohistochemistry images showing DCX+ neural progenitor cells in SS control mice (n = 23 sections), SS mice treated with minocycline (n = 20 sections), SS mice exposed to RSD (n = 40 sections), and SS mice exposed to RSD and treated with minocycline (n = 49 sections). (H) Immunohistochemistry images showing DCX+GFAP+ astrocytes in SS control mice (n = 23 sections), SS mice treated with minocycline (n = 20 sections), SS mice exposed to RSD (n = 40 sections), and SS mice exposed to RSD and treated with minocycline (n = 49 sections). (I) Immunohistochemistry images showing DCX+NeuN+ neurons cells in SS control mice (n = 23 sections), SS mice treated with minocycline (n = 20 sections), SS mice exposed to RSD (n = 40 sections), and SS mice exposed to RSD and treated with minocycline (n = 49 sections). Statistical comparisons were performed with a one-way ANOVA with Fisher’s LSD multiple comparisons test. *p < 0.05, **p < 0.01, ****p < 0.0001. Data are presented as mean ± SEM. ****p < 0.0001. The “n” in brackets after each group represents the total number of hippocampal brain tissue sections evaluated.

